My first time participating in the Makeover Monday challenge was sweet! If there's a way to incorporate music into a viz or a blogpost, I'm likely to do it. Like Sugar, We're Going Down by Fall Out Boy. I thought this song title was appropriate because hopefully it's foreshadowing!
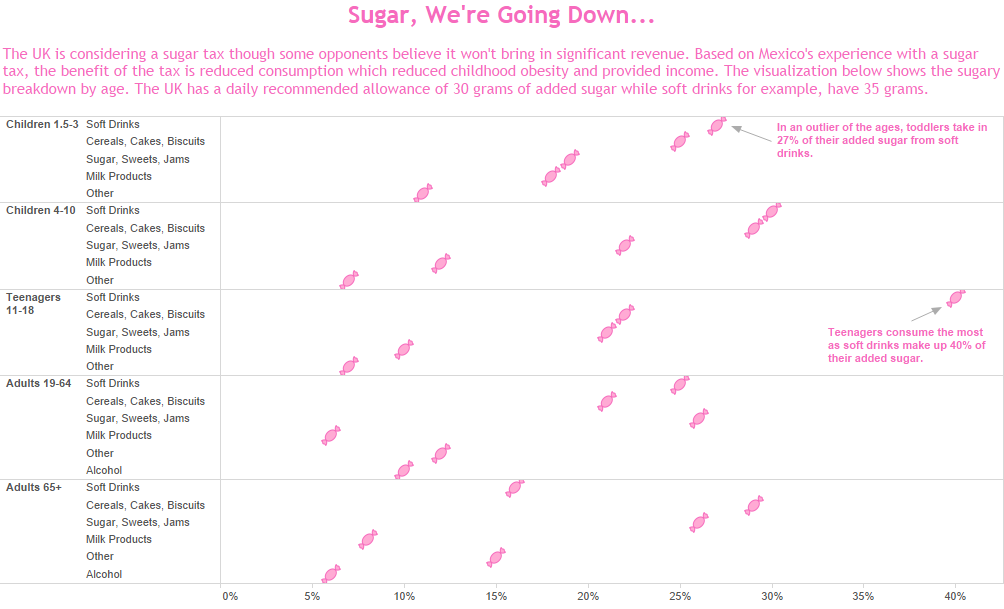
Now on to the viz...I like the wrapped candy shapes and used the pink which represents sweetness (to me) for this viz. I kept it super basic, but hopefully informative. The point that really jumped out at me in the data? Soft drinks comprise 27% of TODDLERS' added sugar consumption!!!! I can't imagine my kids when they were toddlers drinking soft drinks (they had enough natural energy). So here's my contribution.
Now on to the viz...I like the wrapped candy shapes and used the pink which represents sweetness (to me) for this viz. I kept it super basic, but hopefully informative. The point that really jumped out at me in the data? Soft drinks comprise 27% of TODDLERS' added sugar consumption!!!! I can't imagine my kids when they were toddlers drinking soft drinks (they had enough natural energy). So here's my contribution.


 RSS Feed
