Wannabe Awesome Me
  • Viz 'Em
    • Tiny Tableau Tips
  • Mentor Match
    • Mentor Match Blog
  • A Pop of Color

Orioles Magic

10/14/2014

0 Comments

 
I'm not gonna say that I'm the biggest baseball fan or that I'm a diehard Orioles fan.  But I like my O's or as I might have said a few times, #ilikeourguys! By the way, I love all the twitter hashtagging going on for Baltimore (#wewontstop and #BUCKleUp are among my faves and side note: I might use #BUCKleUp a little more since the O's are down two games and the Tuesday night game in KC is a must win). Those O's fans & marketing folks are clever. Anyways, hubs is a diehard fan and I think he started watching the O's in 1984. So as one might suspect, having the O's in the ALCS is a BFD in our household. 


I'm pretty excited for the team and like any good nerd would do, I'm showing my pride by finding a story about the O's I could visualize. Thank you baseballreference.com for the Orioles data set.  There was so much data (all the data! as the cool kids would say). My head was spinning with what I could do. I thought a story around stadiums would be cool because the O's have a long history (and have been in three different cities)! But in the end, I thought back to all of the parody accounts on twitter (which are hilarious...my favorites are Seductive Tommy H and Not Buck Showalter) and thought...it's all about the fans. They are awesome, as evidenced by the following clip.


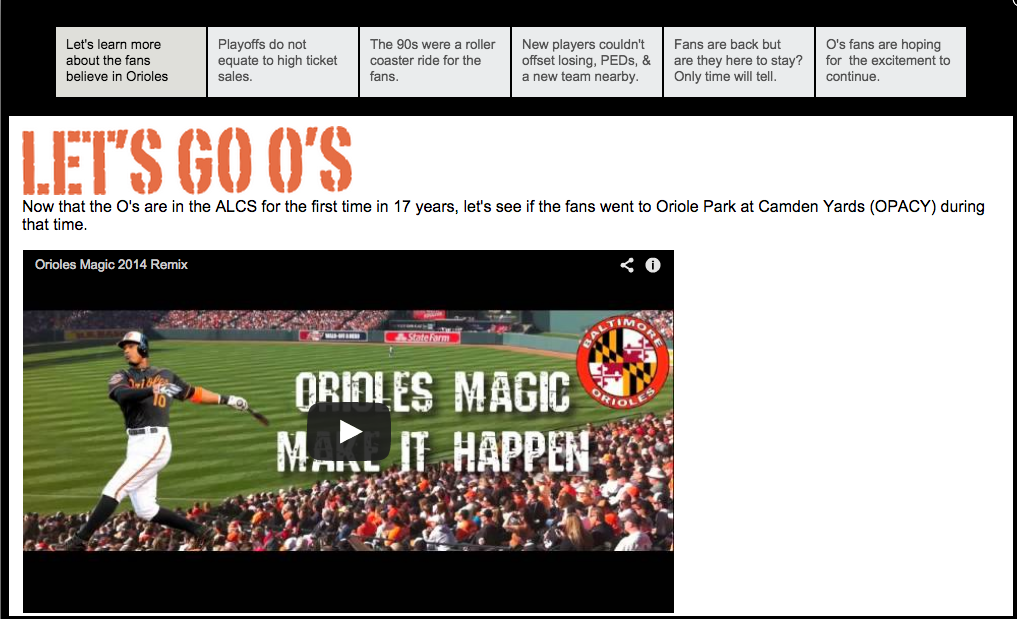
If you aren't pumped up for this viz, then I think you might be a little dead inside (too much??). The fans showed up big time for the first two games of the ALCS, but did they show up to the ballpark for the first ten years in the millennium when the O's were less than stellar (to put it nicely)? Have yourself a little look at this viz I created and find out for yourself. 

Oh, but before you do, I want to give a shout out to two of my favorite viz folks out there...Andy Kriebel and Matt Francis. They provided a really good review and help where needed.  

Okay, now you can go through the turnstyle and see what attendance has been like since Oriole Park at Camden Yards opened.  Interested in the data? Click here. 
Picture
0 Comments

Where Do I Even Start? TUG Quick Reference Guide

10/1/2014

1 Comment

 
I am so super excited to help people that I put together this quick reference guide to help all of the folks who were inspired by #data14 to start a TUG. A super huge shout out to Andy Kriebel for his review and edits! Hopefully this is the first in a series. Click the link under the tips/advice section to add your own TUG tips/advice! 
where_do_i_even_start_.pdf
File Size: 18 kb
File Type: pdf
Download File

1 Comment
    Follow my blog with Bloglovin

    RSS Feed

    What's This About?

    After using Tableau in my last position, I'm now a data viz hobbyist and this is my little slice of world dedicated to data visualization...typically Tableau related. 

    Vizzed and Confused? 
    Here are some great resources!

    Anya A'Hearn 
    Andy Cotgreave 
    Kelly Martin
    Andy Kriebel
    Matt Francis
    Jonathan Drummey
    Jewel Loree
    Peter Gilks
    Paul Banoub
    Dan Murray
    Ramon Martinez
    Ben Jones
    Allan Walker

    Tweets about "#dataviz"
    Tweets about "@tableau"

    Archives

    May 2018
    December 2017
    November 2017
    October 2017
    June 2017
    May 2017
    January 2017
    November 2016
    October 2016
    August 2016
    July 2016
    June 2016
    April 2016
    March 2016
    February 2016
    January 2016
    December 2015
    October 2015
    September 2015
    August 2015
    July 2015
    June 2015
    May 2015
    April 2015
    March 2015
    February 2015
    January 2015
    December 2014
    November 2014
    October 2014
    September 2014
    August 2014
    July 2014
    June 2014
    May 2014
    April 2014
    March 2014
    February 2014
    January 2014
    December 2013
    October 2013
    September 2013

Powered by Create your own unique website with customizable templates.