Wannabe Awesome Me
  • Viz 'Em
    • Tiny Tableau Tips
  • Mentor Match
    • Mentor Match Blog
  • A Pop of Color

December's Data Chain

12/30/2015

0 Comments

 
I loved this month's Data Chain theme-Christmas Music. I knew exactly what I wanted to do and I wanted to get the kids involved!

Because I spend so much in the car, I wanted to track the number of times we listened to Christmas music and who requested it.

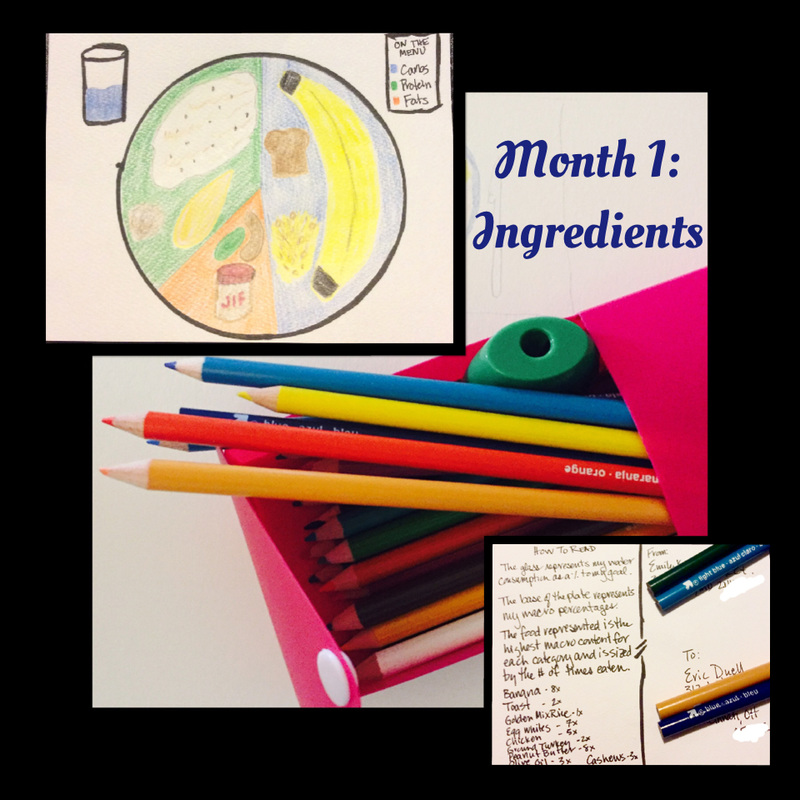
We started tracking the week of December 6th and the same week, I went to a DC Data Community meetup with Catherine Madden as the speaker. She presented and showed off Paper by 53. I downloaded it immediately and started doodling. I also bought the pencil that goes with the free app (which you can learn more about here). The reason why I'm spending time discussing Paper because I saw a great use case for it. I could draw out concepts for my postcard vizzes. Here's some early iterations of December's concept. 
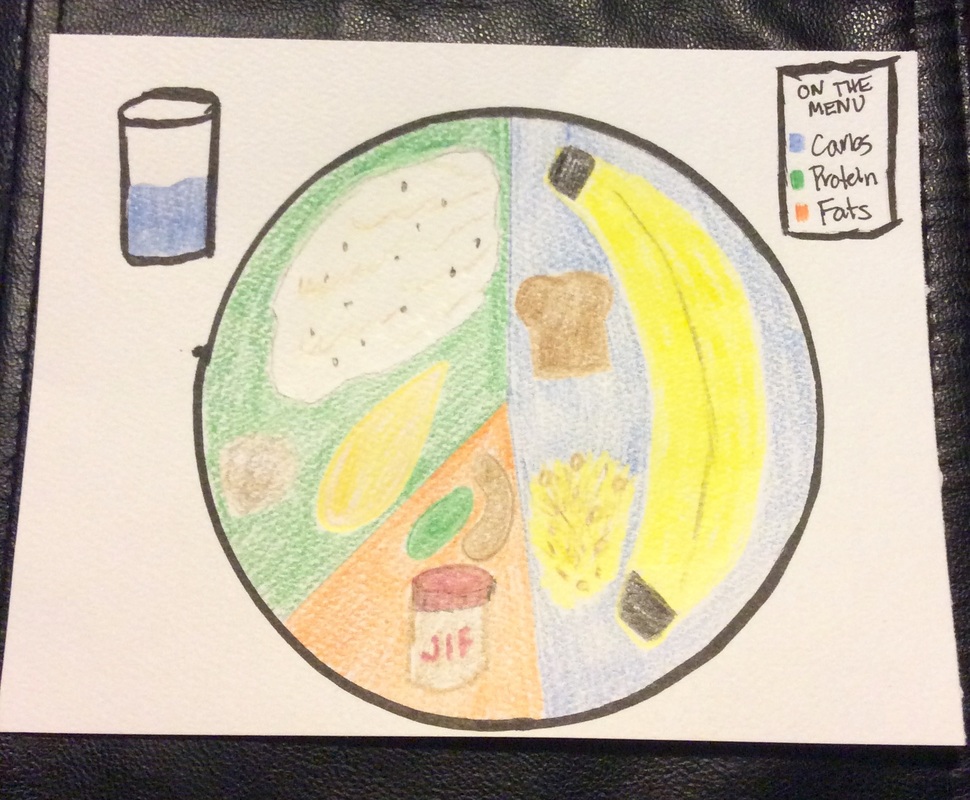
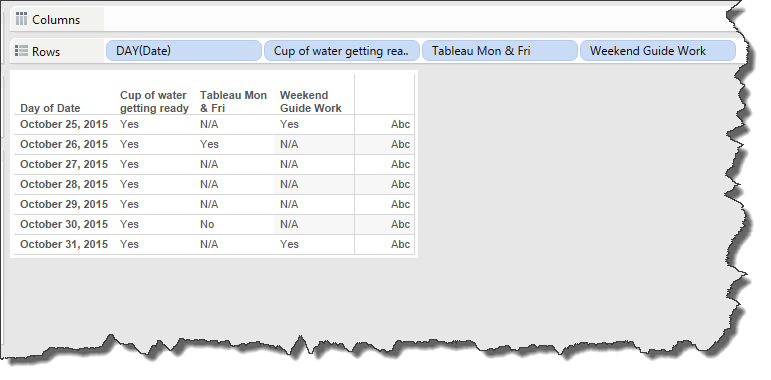
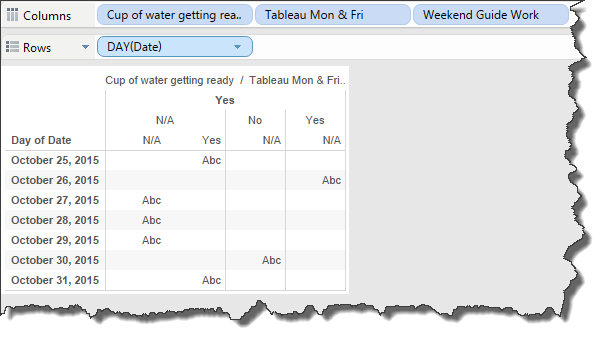
In terms of process, I use Tableau to explore the data and then come up with the postcard. I don't really try to recreate the postcard in Tableau but one inspires the other.

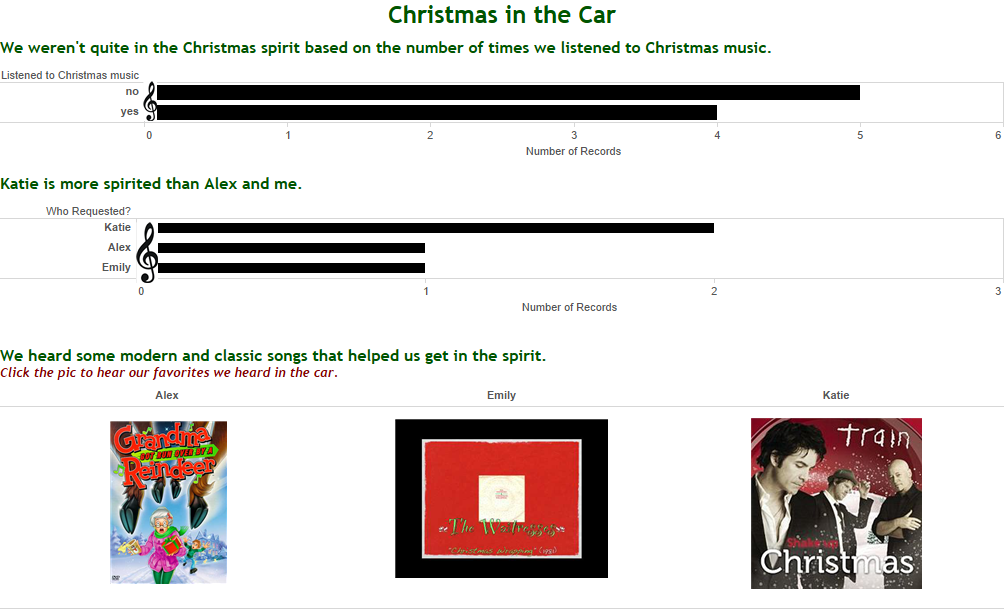
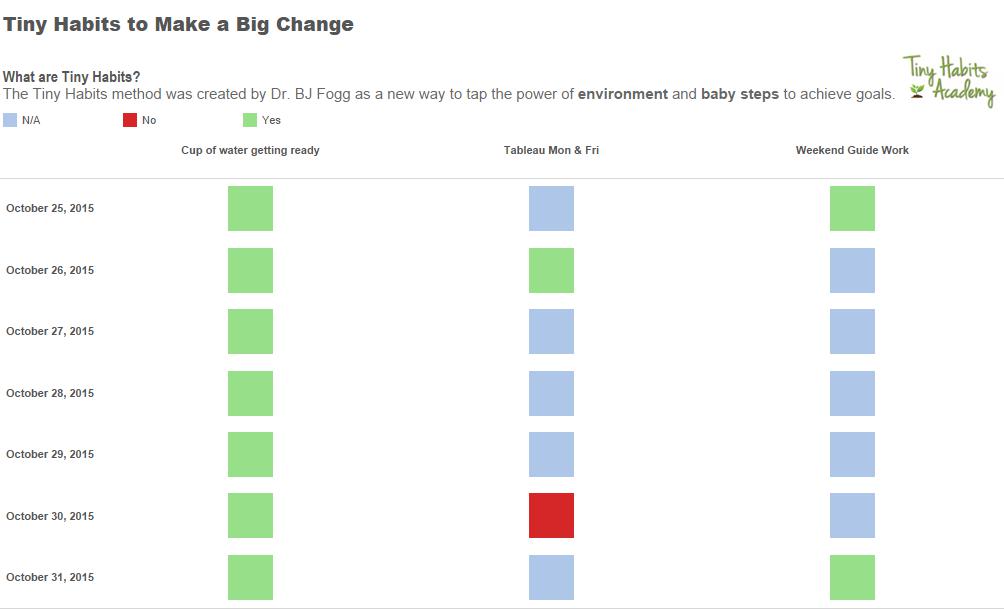
Check out the dashboard I created in Tableau. 
Picture
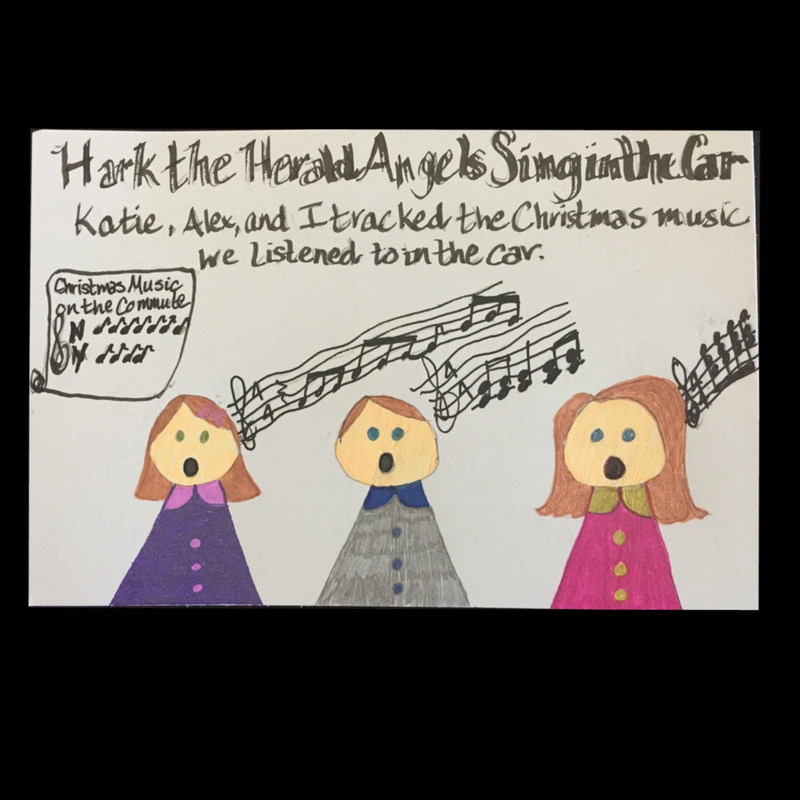
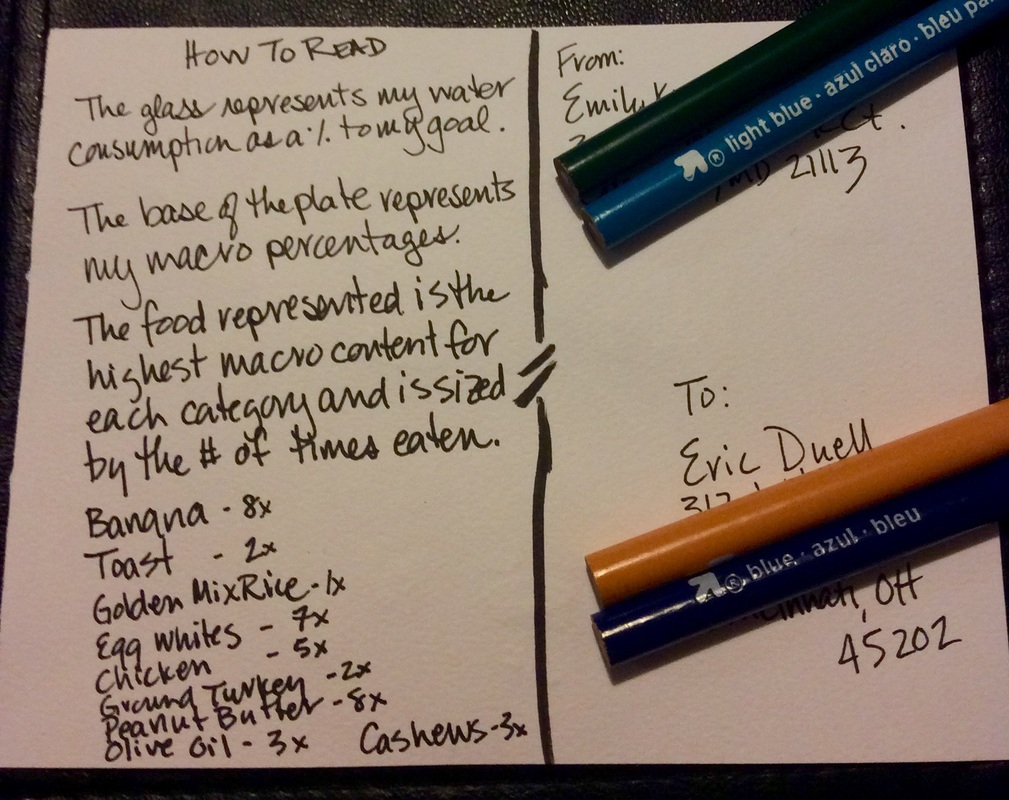
And here is the front and back of the postcard I sent to Emma. I'm not quite sure how I came up with the whole Hark the Herald... theme came from but I like it! 
Picture
Picture
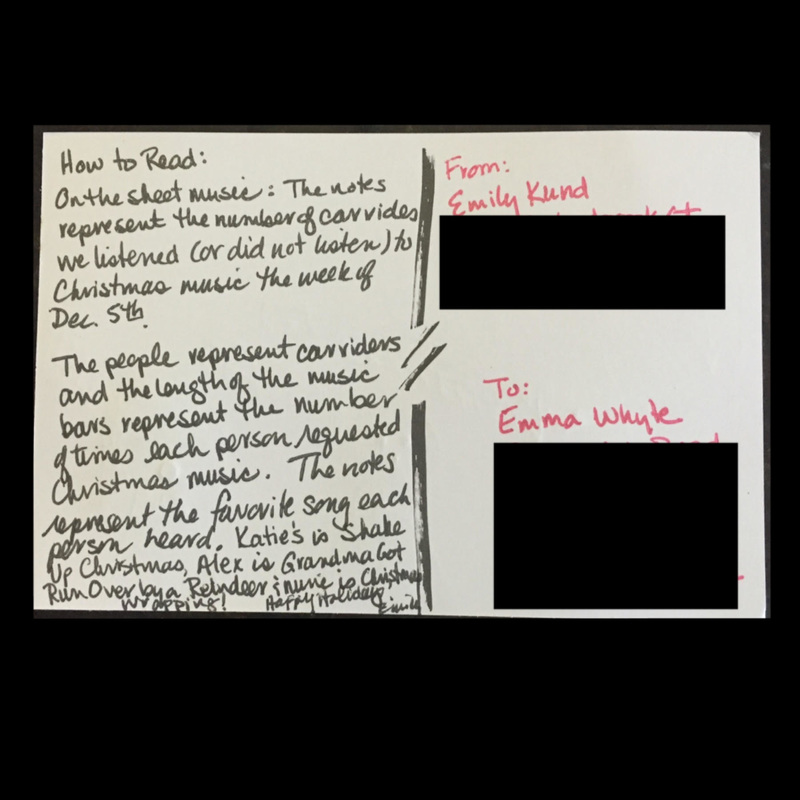
​One challenge I need to overcome: writing less/being more concise in the how to read section. Maybe I'll try a template to be more concise!

Happy Holidays! 
Picture
0 Comments

November Data Chain

12/26/2015

0 Comments

 
I have to include this little clip of Pete Yorn's Life on a Chain, only because every time I think of the Data Chain, it reminds me of the song. 
Now that the song is stuck in your head, I wanted to go through my thoughts on this November's Data Chain. But first, what is the data chain? So glad you asked! It's a project organized by the awesome Brittany Fong and Sophie Sparks, which was influenced by the Dear Data projects. I thought it was a great way for me to be accountable for doing some vizzes and have some fund, so once I found out about it, I signed up!
November's theme was tracking ingredients! I immediately thought of tracking my macros.  I use My Fitness Pal to track what I eat on a regular basis, so this was a great project for me! I wanted to track what foods I ate more often in each category; carbs, fats, and proteins.  I had my data in excel for meal planning purposes, so I connected to that to explore the data in Tableau.  I did all of that, but for some reason, I lost the file (super sad face). I could try to recreate it, but I've got December's I need to move to onto (so maybe when I have some downtime.  
I made some rookie mistakes with my first postcard (it wasn't heavy enough and I feared it would tear), but all in all, I think it was a first good attempt.  Check it out! 
Picture
0 Comments

Presence

12/25/2015

1 Comment

 
Picture
If you're like me (and most people), as we approach the end of the year, you take some time to reflect back and think ahead. I've thought a fair amount about this past year. A few of highlights for me: realizing that I need to be inspired to do a viz; being named a Tableau Social Ambassador; interviewing some big names in Tableau for the podcast; and actually being a guest on The Purpose Rockstar podcast (which you can listen to right here). More recently, I had my aha moment and figured out what I want to do in life and am figuring out how I make it happen to live my ideal day (a concept discussed in Jairek Robbins's book Live It!). At the same time, I've had some amazing conversations with members of the Tableau community.

In some of these great conversations, people have stated that they want to be a Tableau Zen Master (TZM). Someone asked me if I wanted to be a TZM. At first my answer was yes! I see it was a leadership role, providing the platform to help more people and being recognized as a resource would be awesome. I think so many of us have read/heard Jonathan Drummey's So You Want to be a (Tableau) Zen Master blog post. I love it (& you should definitely read it before continuing on...but please come back)! The challenge with it (as I see it) is that I'm pretty sure eeerrrrybody who reads it totally identifies with it and says, “Yeah, I'd keep doing what I'm doing even if I didn't get TZM.”

But I'd suggest to Let Go of the TZM goal (and don't mask it as wannabe jedi when you really mean for jedi to equal zen). 
Picture
Credit: http://adrianimpalamata.deviantart.com/
Let Go of Goals
I'd also submit that we should let go of goals, especially those that are externally driven. ​I started thinking ahead to next year's goals. I had a document written up with my goals and timeframes and was excited to implement. And then I scrapped it.
Why?
That was basically the question. Someone who takes great joy in challenging me, asked me “Why?” My answer couldn't be tied to some great objective. It was simply, "Because I want to get better and help people." So if I relate it back to the TZM conversations...Do I want to be all of those things that TZMs are known for? Pretty much. But TZM or other goals (in my case, being a thought leader) are tied to external decisions, which isn't within my control, so what I can do?
In a Yogi Berra type of comment, control the things I can control. The thing with goals like being a TZM or thought leader is that you have no control over it. You can write all the blogposts, hosts all the meet ups, record all the vlogs, have all the followers, and care deeply about it all you want. But it doesn't change the fact that you're not picking you as TZM or whatever the external goal is. And what a letdown it could be, to do all this work and not meet your goal (those who follow my fitness page know I've experienced this a few times this year). In addition to asking yourself why you really want to be a TZM, I'd offer this up.

Your value is not tied to your TZM status.

The thing is, someone saw some value in them based on some criteria.  It doesn't mean they are the nicest or the smartest, or the kindest, or the best people in the world, it means that they excel based on criteria. And just to be clear, this isn't some kind of down with the man post, it's simply to reinforce the fact that one person's value is not tied to a title). As much as I enjoy data viz and Tableau, it is not the only thing in life.  

​I think at some point we've all played the 'Why is X a TZM?” Usually followed by a game of comparison. This reminds me of one of my favorite quotes. 
​
Picture
Look, it's not like I'm sitting on some pedestal, pretending I'm so enlightened and that this is so easy. It's hard. I like goals.  I have a workout tank that says Goal Digger. My mom even says I'm never satisfied; I'm always trying to be and do better. But, I did something super uncomfortable and I scrapped my Tableau goals.
What do I do without goals as guideposts?
So, if I'm doing this whole 'control what I can control' thing. Then, I start thinking about what it is that I can do if I really want a goal.  I can control the number of vizzes I publish. Though I learned that the number of vizzes is a meaningless metric for me. I was telling one friend that I can't just do a viz for the sake of doing a viz. I need to be inspired. I've realized that trying to be technical is just not my cup of tea. Calculations will likely never be my jam. But color on the other hand, it's my cupcake. Being curious and having good conversation? That's like the coffee to my cupcake.  

But what if people don't like what I contribute? Find no use for it? I'm choosing to ignore those questions. Not everyone will like or appreciate what I write or say. Not everyone sees my value...or yours. And that's okay. I treat my blog as though it's a viz diary that I've let the world read. It makes me happy and that's why I do it. Over this past year, I've been trying to embrace the concepts in Strengths Finder. I'm trying to key in and refine those strengths. Maybe learning a little bit about myself helps shape what I do, goals or no goals.
Be present and enjoy
So basically what I learned this year was to continue to step out of my comfort zone, be present in my data viz work; enjoy the projects (like Data Chain and the podcast). And then maybe I'll reach Nirvana. Or not. But I'll have the gift of presence and I hope you do too.
Picture
1 Comment

Tiny Habits in Tableau's Data Structure

12/7/2015

0 Comments

 
​I wanted to track and visualize my Tiny Habits data, so I entered it into Google Sheets so I could try out the relatively new web data connector. That was a fail. But it's something I'll have to try again (a WDC worked so well with my fitbit data-thanks Craig!). Instead, I downloaded the data into an Excel document and used the plain ole boring Connect to Data via Excel. I ran into some questions along the way, so I reached out to Jonathan Drummey to help me understand what's going on. Jonathan's knowledge about data and Tableau is immense and he is gracious enough to provide some of his pearls of wisdom throughout this post (in the green narrative to the right).  

But let's start from the beginning

First, what are Tiny Habits? They are based on the concept that by using an anchor and taking a micro or small action, you can build up to a bigger change.  For example, my bigger habit is that I need to drink more water (a gallon a day). In order to work up to that, I'll use a tiny habit based on an anchor such as...After I push the power button on the coffeemaker, I will drink a cup of water. You keep building on these habits until you achieve the bigger habit.  So I entered my data as shown below, where I had each date on a row, and tiny habits on columns. I entered it in a format that made sense so I could see how I did each day. 
Hi, Jonathan here. I’m virtually going back in time to kibitz about the steps Emily took with this data. 
Picture
​Woohoo! I have data!
Picture
'Now I want to visualize it so that I can see my data and make my message pop. Let me throw it into Tableau so that I can answer this question...

Did I do my all of my tiny habits each day? 
Picture
​What the heck? That's not making my message pop. 
Picture
​I was looking for a heatmap or something to really highlight when I did not do my tiny habit. The problem with the above is that I have to read through all of the data values shown to see that on October 30th, I did not open my Tableau program after waking up.  Plus, it's gray and boring.  I need a pop of color in my life. 
​
Let me try this. ​
Picture
Ok, so Emily is running into some problems trying to visualize the data. Sometimes this is a matter of knowing the right option to choose, just as often it can be the data structure.
​Dang it, that didn't work either. Maybe if I pivot the view.
Picture
The feedback Tableau is providing is indirect, it’s an indefinite and growing dissatisfaction that nothing is working right as she tries different avenues. That’s most often a sign of issue(s) with the data structure.
Maybe it's something with the structure of my data. I thought I created a tall data set, which Tableau likes. Wouldn't it be wide if I had the dates on the columns and the habits on the rows? Maybe it needs to be wide?  I'm not really sure what to do at this point, except to call in my data expert. 
Picture
Yes! What excites me here is that Emily recognized that there was a problem and reached out for help before getting to the point of throwing her computer out the window.
 talked with Jonathan Drummey about my conundrum and learned a couple of things.

1) My three tiny habits are part of a super dimension. I didn't know that was a thing! Conceptually, I get it. Water, Tableau, and weekend guide are three items that make up my tiny habits. I need to consolidate the three into one because I have more dimensions than shelves. If I just throw one of the three, say water, on the color shelf, it's only visualizing my water results, not my overall performance (what I really want).

2) To get this super dimension, I go to the data window, select the three columns I want to consolidate and click pivot. Watch this super short, silent video on what to do. I renamed the data (by using the down arrow) to my super dimension: Tiny Habits. I can rename my results as: Results.
I’m always looking for categories that are crossing columns of the data. If you’ve built databases before then you’re used to hunting for these patterns, if you haven't then this is a new skill to build. A couple of examples: Survey questions Q423, Q814, etc. are all members of a "survey question” category. Jan, Feb, Mar, etc. are all members of a “month” category. Besides the challenges with the layout above, another sign is what Emily stated so well: "I have more dimensions than Shelves" where she wanted to put Cup of water, Tableau..., and Weekend Guide all on the Colors shelf in the same view.
​Sweet! Now if I go back to the worksheet, I can throw date and tiny habit on the view, and put result on the color shelf and yippee skippy, I have a visual! Now I can see I didn't open my Tableau program on Friday. 
Picture
Now that the data is in the right shape, Emily is in the getting the results she wants with the ease she expects. The good news here is that once we recognize the pattern Tableau is able to get us past it in a few clicks.
​So that's cool and all. I can format this and make it what I want know. But I asked Jonathan this question,

"So how should I have structured the data?”

I wanted to know if it was an issue on my end so I could learn from it. Jonathan explained three different examples and the consequences of each. 
​Option 1) Enter the data as you (or I) would think about it. The benefit here is that the data is fully padded, but you'll just need to consolidate the tiny habits once inside Tableau (and as I learned, it's not difficult). Though I thought I was creating a tall data set, it was actually wide. ​
Picture
Picture
Option 2) Tableau likes, but you might need to do some work (a table calc to pad the data with N/As) once inside. Here's what it looks like:
Picture
  

Picture
​Option 3) Create a tall data set. This isn't intuitive for me, but what you'd do is to have date and result with the date repeated for each tiny habit to record the result. Here's what it looks like. 
Picture
Picture
'So, Tableau likes options 2) and 3) because they're tall, but number 1) is more intuitive for me (and maybe you?). So what should we do? It depends on what level of work you want to do. Do you want to do a table calc to pad the data (heck, no! table calcs are not for me). Want to put the data in a format tableau loves? Then option 2 or option 3 are your best bet.

The conversation with Jonathan was super insightful for me because I needed to see and experience the real life 'if this, then that' of data structure and how it impacts what I do in Tableau. And as GI Joe would say, "Knowing is half the battle." A super huge thank you to Jonathan for annotating this blogpost! And now that I have that little bit of knowledge, I build out a viz like the one below.
What Emily said here is right on, there is no single data structure that works in all cases.
Picture
0 Comments
    Follow my blog with Bloglovin

    RSS Feed

    What's This About?

    After using Tableau in my last position, I'm now a data viz hobbyist and this is my little slice of world dedicated to data visualization...typically Tableau related. 

    Vizzed and Confused? 
    Here are some great resources!

    Anya A'Hearn 
    Andy Cotgreave 
    Kelly Martin
    Andy Kriebel
    Matt Francis
    Jonathan Drummey
    Jewel Loree
    Peter Gilks
    Paul Banoub
    Dan Murray
    Ramon Martinez
    Ben Jones
    Allan Walker

    Tweets about "#dataviz"
    Tweets about "@tableau"

    Archives

    May 2018
    December 2017
    November 2017
    October 2017
    June 2017
    May 2017
    January 2017
    November 2016
    October 2016
    August 2016
    July 2016
    June 2016
    April 2016
    March 2016
    February 2016
    January 2016
    December 2015
    October 2015
    September 2015
    August 2015
    July 2015
    June 2015
    May 2015
    April 2015
    March 2015
    February 2015
    January 2015
    December 2014
    November 2014
    October 2014
    September 2014
    August 2014
    July 2014
    June 2014
    May 2014
    April 2014
    March 2014
    February 2014
    January 2014
    December 2013
    October 2013
    September 2013

Powered by Create your own unique website with customizable templates.