|
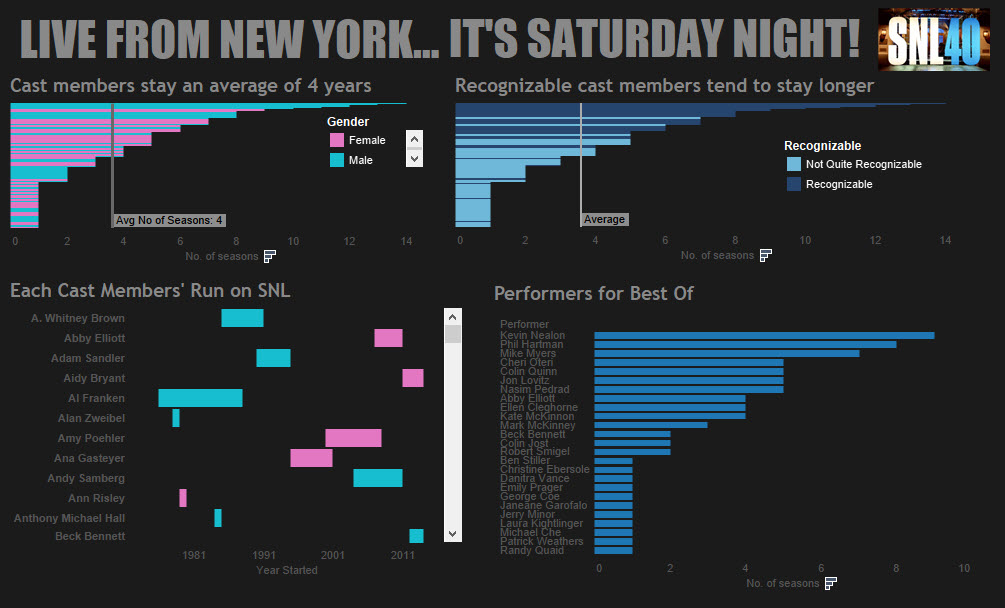
As part of my Do Something goal and inspired by SNL40, I made this little viz. It's not perfect, but it's something. I'm actually looking forward to playing with this viz even more. Big props to Matt Francis for giving me the idea and to Andy Kriebel for suggesting a Gantt chart (which is actually the first one I've done)!
2 Comments
Hey everyone! Women's History Month is approaching and to celebrate it, I thought it would be awesome if we could get a gallery of women's empowerment visualizations and stories. As a result, I'm hosting my first ever virtual data viz event called Women's Empowerment Viz 2015 (aka WE Viz 2015). I felt compelled to take action as a result of a Bread for the World/ Help Me Viz hackathon I attended last year. It was through that hackathon that I felt like it wasn't fair that that in some parts of the world children are stunted because there isn't enough money to put food on the table. One contributing factor is that for various reasons, women are not economically empowered in parts of the world. Stunting is a major issue, but there are other issues, like pay equity or paid maternal/paternal leave. These are not just lady issues; they are family issues. I have always believed that if we have the ability to make something right, we should take action. Side note: with this attitude, it's a wonder I haven't been involved in protests or arrested. I guess I use my powers wisely. Check out this little clip about WE Viz Join me! Be a #datadogooder and participate in #WEViz 2015. Check out the WEViz page for more information and don't forget to register through Eventbrite, as I have a little something for participants. Additionally, I want to acknowledge participants so I'll do shout outs through social media, blog posts, and the podcast. It's a great way to do some good and to get more visibility for your work. My hope is that through this event, people become more aware of the issues and that a visualization or a story will resonate with someone and they take some of kind of action to make the world a little better place. Change can be slow, but often times worth it. |
What's This About?After using Tableau in my last position, I'm now a data viz hobbyist and this is my little slice of world dedicated to data visualization...typically Tableau related. Vizzed and Confused?
|

 RSS Feed
