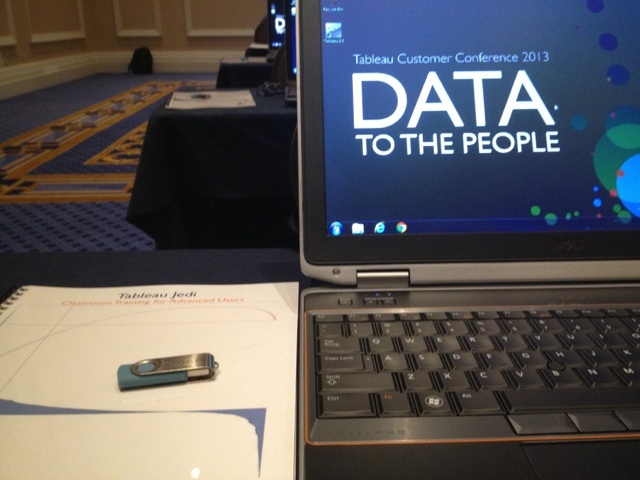
Attending the Tableau Customer Conference is a few fun-filled, high energy days where I get to focus on all things Tableau. It's great to have the energy and passion for helping people see data...as well as the tool to do it. For some reason, I approached this year's conference with a slightly different perspective. This year, it was about networking, where I tried to achieve a balance between topics that I wanted to learn about and supporting the folks in the Tableau community that I've come to know over twitter (shameless plug for you to follow me @emily1852 where you get to see musings in full effect for everything from makeup (love my girl Jessica & my boy Matt at the Annapolis Sephora) to data visualization to fitness to football (#HTTR).
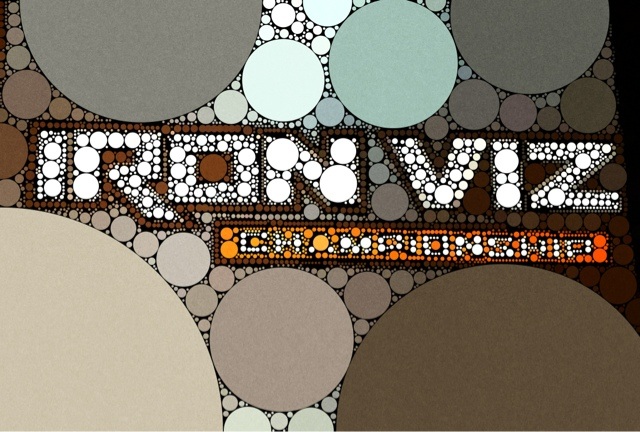
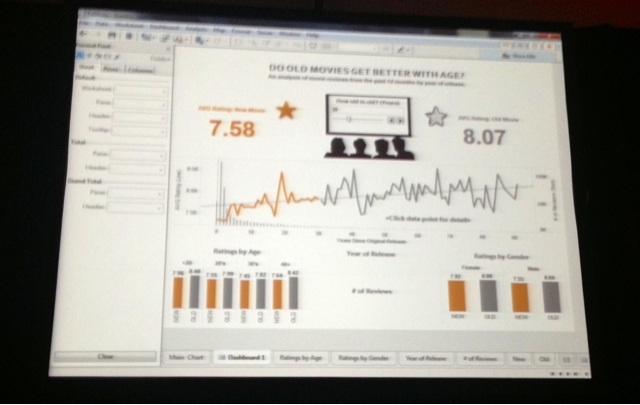
I think the biggest thing that struck me from this conference was how beautiful and polished these visualizations can be. This Fireworks Injuries visualization is so cool and not all charty. It was this visualization that caused me to be evangelistic when I got back to the office and was chatting with someone who is not Tableau's #1 fan.
Me: Look at this viz (showing pictures from my phone of the iron viz challenge), there aren't all charty, they looks so professional! We have to aspire to this level, otherwise, we are going to publish visualizations that look all charty, and not harnessing the beauty.
Her: <Speechless>
Me: It really depends on the skill level as to how good it looks, It will look like a plain bar chart if that's all the person knows, but if you know the visual aspect and really know how to use the tool, it can be something really beautiful.
Her: Yeah...it's that way with Excel too.
Me: Oh yeah, I think we need a reference guide as to using the most appropriate tool.
And with that, we ended that conversation.
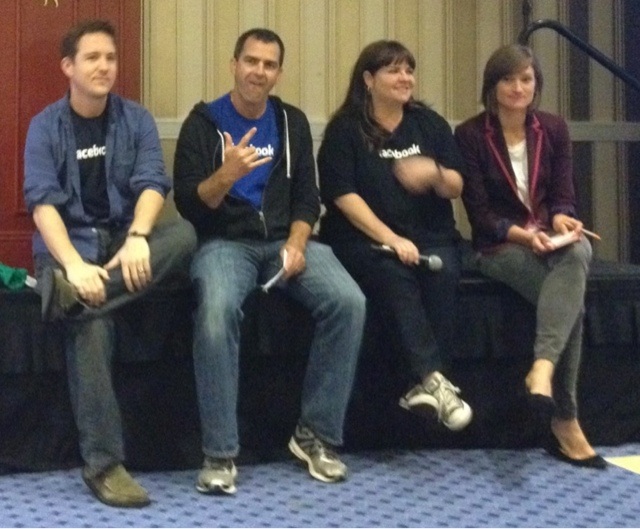
A few other things that stuck with me...I love the way that Andy from Facebook has really established a good culture for Tableau usage..the office hours, the hackathons, and the marketing. I think it sets a good Tableau foundation, which is what I want to establish and communicate at work.
I also really appreciated the way that Anya brought emotion to her dashboards and how awesome they look. And the way that Kelly Martin has a great perspective and thought that she brings to her visualizations. Oh, and I can't forget a person I discovered at the conference (that's known to many), Ryan Sleeper, who also puts great thought into his work and makes it seem so effortless. I can't forget the random dude in the audience of one of the sessions who had an idea to record a tutorial and embed in the visualization.
There were so many great things I learned and people I met in person and for the first time, it really help build my network of Tableau peeps. So I ended the week energized and resolved. I resolved to up my Tableau visibility and publish at least one viz on Tableau Public (and we'll see where it goes from there). Big props in advance to Matt Francis for helping me expand my network! I'm also resolved to better understand and apply design concepts to make data beautiful and something that folks want to see.
So all in all, I think the Tableau Customer Conference was pretty successful for me. Now to catch up on some of the sessions that I wanted but didn't have the chance to attend.
I think the biggest thing that struck me from this conference was how beautiful and polished these visualizations can be. This Fireworks Injuries visualization is so cool and not all charty. It was this visualization that caused me to be evangelistic when I got back to the office and was chatting with someone who is not Tableau's #1 fan.
Me: Look at this viz (showing pictures from my phone of the iron viz challenge), there aren't all charty, they looks so professional! We have to aspire to this level, otherwise, we are going to publish visualizations that look all charty, and not harnessing the beauty.
Her: <Speechless>
Me: It really depends on the skill level as to how good it looks, It will look like a plain bar chart if that's all the person knows, but if you know the visual aspect and really know how to use the tool, it can be something really beautiful.
Her: Yeah...it's that way with Excel too.
Me: Oh yeah, I think we need a reference guide as to using the most appropriate tool.
And with that, we ended that conversation.
A few other things that stuck with me...I love the way that Andy from Facebook has really established a good culture for Tableau usage..the office hours, the hackathons, and the marketing. I think it sets a good Tableau foundation, which is what I want to establish and communicate at work.
I also really appreciated the way that Anya brought emotion to her dashboards and how awesome they look. And the way that Kelly Martin has a great perspective and thought that she brings to her visualizations. Oh, and I can't forget a person I discovered at the conference (that's known to many), Ryan Sleeper, who also puts great thought into his work and makes it seem so effortless. I can't forget the random dude in the audience of one of the sessions who had an idea to record a tutorial and embed in the visualization.
There were so many great things I learned and people I met in person and for the first time, it really help build my network of Tableau peeps. So I ended the week energized and resolved. I resolved to up my Tableau visibility and publish at least one viz on Tableau Public (and we'll see where it goes from there). Big props in advance to Matt Francis for helping me expand my network! I'm also resolved to better understand and apply design concepts to make data beautiful and something that folks want to see.
So all in all, I think the Tableau Customer Conference was pretty successful for me. Now to catch up on some of the sessions that I wanted but didn't have the chance to attend.
 RSS Feed
