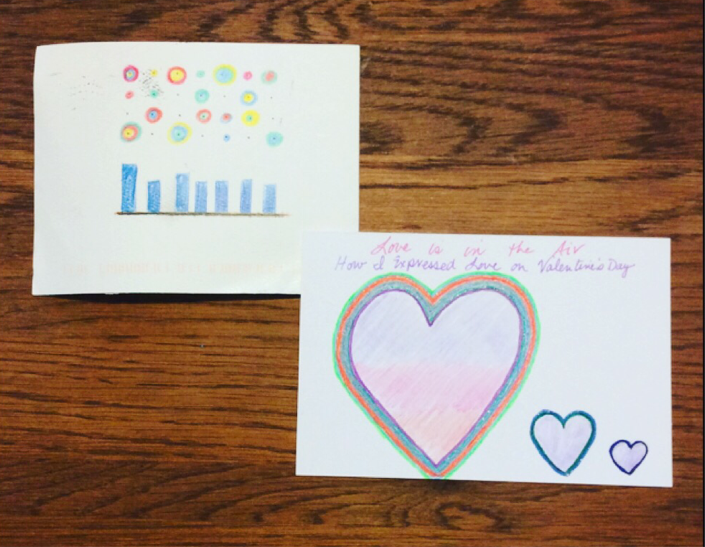
And if you're wondering, Katie chose to be the color purple on the border and loved the hearts and rainbows.
|
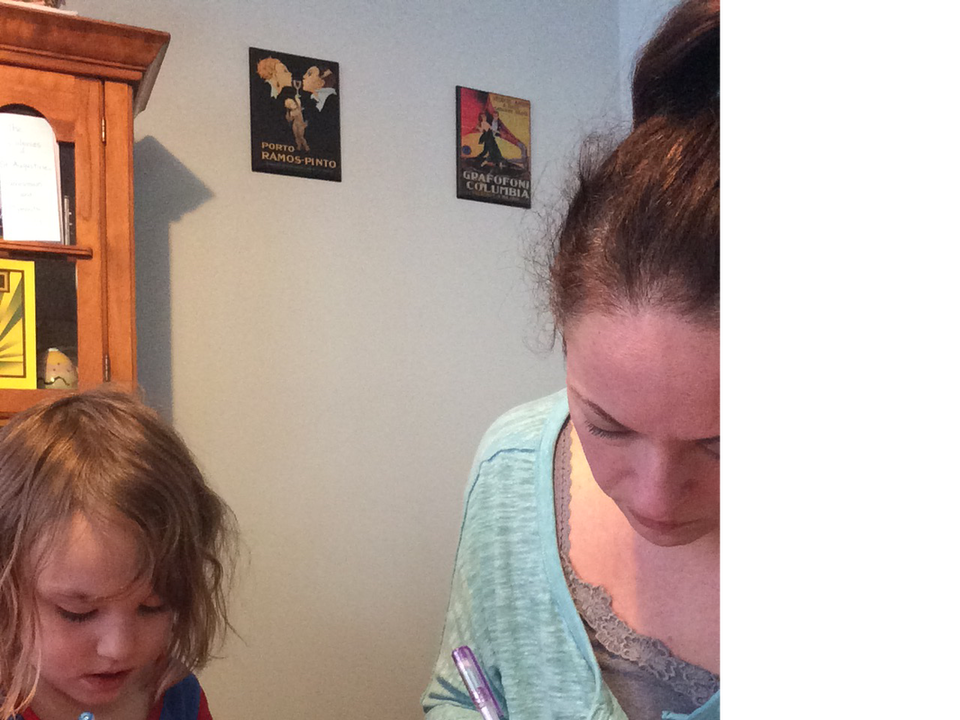
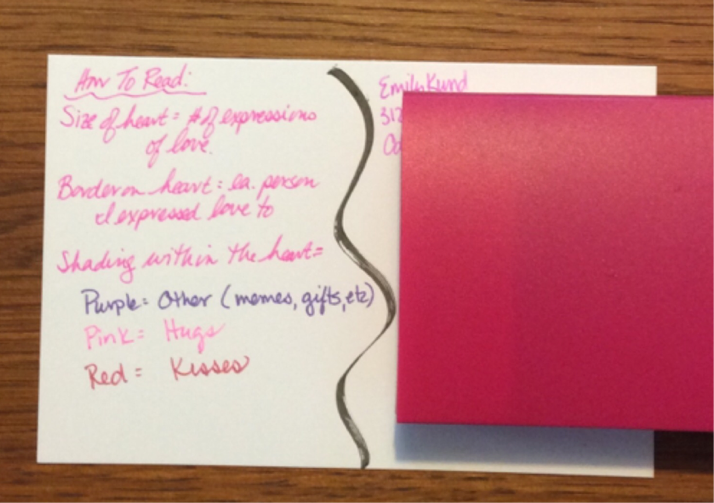
I was super happy to see February's theme; love. I knew I wanted to do something around Valentine's Day and so I decided to track how I express love. The kids and I started Valentine's at my parents' house and due to a snowstorm, cut the trip short and returned home. I went analog at first by tracking the expressions of love in my notebook, then transferring the to google sheets, where I connected to the data using the web data connector (seriously one of the best features IMO). I created a few different charts but I had trouble coming up with a design/theme (which is just one reason I was late getting this card out). I use Tableau just for data exploration for Data Chain work. I might fancy it up a little, but I really look at it as a means to an end. Spending time with my mini-me brought me design clarity. One of the side benefits of being late is that I could capture the two cards in one picture (silver lining)! So there we have it, I'm all hearts and rainbows. The hearts are shaded by the types of love. Purple is for memes, gifts, etc, while pink is for hugs, and red is for kisses. The borders around each represent the people I expressed love to. The big heart is for my family, the middle heart is for friends, and because I love social media, the small heart represents a Facebook post. One thing I learned from this month's data chain is that I need to show more friends love.
And if you're wondering, Katie chose to be the color purple on the border and loved the hearts and rainbows.
0 Comments
Leave a Reply. |
What's This About?After using Tableau in my last position, I'm now a data viz hobbyist and this is my little slice of world dedicated to data visualization...typically Tableau related. Vizzed and Confused?
|



 RSS Feed
