Inspired by Tableau's Design Month, I thought it would be cool to have an Iron Viz like contest at work that focused on design. Data is super important, but it's not the only important aspect of a visualization. I think the Iron Viz and our Design Skills to Thrill contests really highlight that the data and design are important; design can draw people in (think of this year's Iron Viz Champ, Ryan Sleeper's winning viz Do Old Movies Get Better with Age?) or turn people off (like my early stuff and no, I'm not providing a visual because I don't want to make your eyes bleed).
A few of the contestants described their Tableau skills as basic and were concerned about their abilities. And while I think filters, actions, and parameters are total awesomeness, they aren't required to create an interesting visualization that you want to look at, so those folks were encouraged to give it a go. By the way, I love to plan and make lists (I'm making a mental list right now!), but I didn't do any of that for this contest. As a result, I hyped it up one week before it was held and hoped for the best. I think participation was good in spite of my poor planning.
So let's take a minute and chat about the data, shall we? I wanted to do something fun and not work related, so I downloaded Halloween data from the National Retail Federation website, combined it into one excel workbook, and bribed a data dude at work with a slice of cheesecake (thank you Wegman's) to give me a little help so that the data wasn't the biggest challenge. Data ranged from a yes/no as to whether folks would celebrate Halloween to economic impact, planned spending, and other fun stuff. Contestants received the data about one day in advance to review and start to think through what story they wanted to tell and how they might present it. These five brave folks had 45 minutes to create their visualizations (no pre-built worksheets or dashboard were allowed) while their coworkers watched the magic happen before their eyes. I channeled my inner Ross and Jewel and whew! that's a tough job for one person. I did not have the showmanship that Ross displayed while biting into the pepper, but I did supply a pumpkin dip for the audience to snack on. And interestingly, one of the contestants brought atomic fireballs in for folks (personally, I think he was trying to buy some viz love and as a result, I now call him Fireball). All contestants were very polite towards each other, even though I thought one might have started trash talking, which I totally encouraged.
While the contestants were doing their thing, I talked to the audience, asking questions about what they wanted to get out of the contest to whether they tried the pumpkin dip (I made the deliciousness up at 10pm the night before), to probing questions as to why they didn't enter (when I know they have the skills). I made best friends with a couple of folks who told me that I was doing a good job emceeing (Ross & Jewel would be proud). I was totally hamming it up and had fun with the audience members. I also used that time to ask folks about some of their takeaways from TCC13 since this was the first time a bunch of Tableau users were together in the same room (and here's a shameless plug for my TCC13 blog post).
The contestants were nervous I think, but they all did a fantastic job. It was cool to see the various types of visualizations, one incorporated a 'sophisticated analysis' (conclusionary) paragraph, while others brought in images from ye ole internet. Interestingly, two of the contestants went with the same color scheme, but in the end, there could be only one winner. Each contestant was the Flavor Flav for their viz (google hype man and public enemy and it will make sense if it doesn't already). And at the end, the winner was chosen using a decibel app on my phone by how loud the audience applauded. And the (image of the) winning viz is...
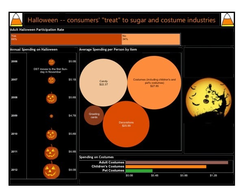
One of the items that the winner discussed was thinking about whether there was too much on the viz. That was a topic I heard discussed throughout the conference. I call think of the accessories rule. When putting on your accessories, take a look in the mirror and then take one accessory off, then you will look good. It's basically the less is more/don't junk up your viz idea for those who don't accessorize (I'm not sure who that might be, but I put it out there anyway).
So the contest was a success and people want to do it again next year! The winner received a $25 Amazon gift card and all contestants received a mini oscar trophy for being brave enough to build a viz with their bosses, friends, and coworkers watching. I told someone I was a like a mama hen, proud of her chicks. I am proud that the contestants that weren't afraid to fail (dang, that's another takeaways from TCC13) and amazed at what people can do with the same data and the same tool. And I am pleased that the five contestants from different areas within our organization have connected and built a network, which should better our reporting, analytics, and organization as a whole. I totally had a blast and one of the contestants told me I reminded him of Bob Barker, to which I replied, "Don't forget to spay and neuter your pets!" (I'm taking it as a compliment and not that I look like an elderly white haired man).
So next year, I'm thinking smoke machines, music, a chest filled with items that represent the data being visualized, and a Ross to my Jewel to co-host. Thanks to Tableau for thinking about Tableau Design Month, so that I could have a fun and educational event at work.
 RSS Feed
