Wannabe Awesome Me
  • Viz 'Em
    • Tiny Tableau Tips
  • Mentor Match
    • Mentor Match Blog
  • A Pop of Color

Dear Diary 6.19.15

6/19/2015

1 Comment

 
Picture
Picture
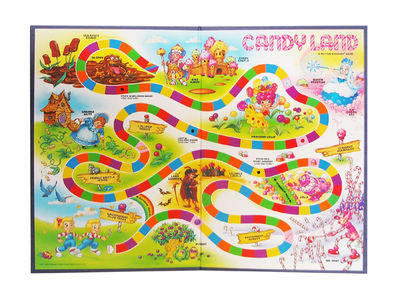
I was thinking the other day that learning how to use Tableau is much like playing Candyland. You think you have the general idea of how the game works and then you learn some of the instructions and it's like getting the black dot card and losing a turn. I think there are four responses after getting a few of these blank cards. 
Picture
  • Flip the board over, say eff it, and play a new game
  • Get someone to play for you
  • Ask someone to help you understand how to play
  • Do the hardest thing and figure out the instructions for yourself. 
Sometimes I feel like option 1. Why does it have to be so hard? I'm not super detailed when it comes to data. It's like I'm trying to play piano and I pound on the keys. Sometimes it sounds great. Sometimes it's a bloody mess. I also have negative self-talk, questioning myself if I even be using the tool.

Then I take a breath and ask myself...is this fundamental? Do I need to know this to have a basic working knowledge of the tool? And how quickly do I need to learn this? If it's for my Tableau Public work, it's rarely urgent. But as I've written ad nauseam, I don't have a lot of free time so that means if I'm going to spend time learning about something, it needs to be important to me. And while it would be easy for me to ask a friend to help me out and take care of the obstacle, it's not really helping me out in the long run. Yes, I suppose I could reverse engineer the workbook so I could mimic what was done. But let's be real...rarely have I done that (primarily a time issue). Plus, my challenge is that it's one person's take on it. It could be the hackiest way to do things when there was a more direct way of doing things. In my day job, I've told folks that you can't shortcut a shortcut. Meaning, if you only learn from the hacky/speedy way of doing things & that's your baseline, you may be missing fundamental concepts. Of course it seems impossible to learn every single scenario that could be encountered. I don't think it's necessary (or possible) to learn every possible scenario. It's learning enough to be able to transfer and apply the knowledge learned to all other scenarios.

So where does that leave me? As much as I'd like to flip the board over, I don't foresee that. I really love data visualization, even if I still have a ton to learn. I can't get someone to play for me because it's like cheating (myself). Do the hardest thing and figure out how to play by myself? I'm not thinking this is a good option because of time and inexperience, which could lead to being frustrated and then wanting to flip over the board. That leaves me with reaching out for help. Ugh. Not super excited about this because it's scary for a couple of reasons. It's admitting I don't know what I feel are the fundamentals and the person helping me may get frustrated with my inability to pick up the subject. However, it's the best option I have. So that's what I'm doing.

As I think about all of this, I've also started to think about what I consider to be my strengths when it comes to visualizing data and some other fun observations. Like when I'm at work and someone is talking about data and what they're aiming to measure, I start thinking about the chart type (then I switch back to focusing on the content---which is actually my primary job). Or the thing that I enjoy the most is telling a story through the annotation layer. I think it's because I like to write and I think of the introduction, the body, and the conclusion of the story. I like thinking about all of the design elements that go into dashboarding. Much like I'm not a Jonathan Drummey for table calcs, I'm no Anya A'Hearn when it comes to dashboarding. But (& this is the most important part I think), I enjoy it. So I'll most likely miss the mark sometimes, but I'm sure I'll learn from it (feels a bit like Maxwell's Failing Forward).

Well, I think entry turned into a novella! Until next time...

Picture
1 Comment

KidsCount

6/15/2015

2 Comments

 
Picture
I've tried to write this blogpost several times and each time, I can't find the right words. So I'm writing because I'd rather have the experience documented than just a memory in my head. Plus, I wanted to share my outline. 

Someone from this group, KidsCount, reached out to me to help them with a Tableau Public 101 Webinar they wanted to host for their folks in each state. First, a big shout out to MC Dingh who connected KidsCount with  me...you rock MC!!! This was webinar also served to prime the attendees for a more in-depth data workshop at their conference in early May.  Holy cow!!! I think The first message to my data BFFs was “OMG YOU GUYS. I'm so super excited!!” Then after I actually had time to think about it (and after they kept calling me a Tableau expert a couple of times), I thought, “Oh shit. I have to do a really good job with this. These folks are gonna look to me to have all the answers. I don't have all the answers. I feel remedial sometimes. Maybe I need to recommend someone else.”  Then I told myself to buck up.  I needed to do this and I should do this. And yeah it was scary, but it was good for me. One of the things that helped tremendously was that I clarified that I was no expert. This was a risk. But I used it as a positive. 

You don't have to be an expert to develop a good visualization in Tableau. 


So that was my goal. Give the attendees a good introduction to Tableau Public so that they could create good visualizations. 

In the days leading up to the webinar, my daughter had her tonsils and adenoids out. I was expecting her recovery to be like my son's; rest with lots of Slurpees. Ah kids...you expect one thing, they do another. I was going to use that time she was resting to really draft out some super awesome talking points, do a couple of dry runs, & catch up on blogging. 

Are you still laughing?  I am. 

So what really happened is that I commissioned the TV be a babysitter when I did a tech check for about 30 minutes.  This time was really all about Katie so I otherwise spent time hanging out with my favorite chick and I worked on my talking points the weekend before the webinar. I also scheduled a dry run with one of my data friends, who I thought would provide constructive feedback in a way I could handle. That was super helpful in identifying where I needed to shore up my talk & other logistical items.  

April 24th rolled around and I felt mentally ready to rock. I also know a couple of things about me. I like early afternoon presentations. It gives me time in the morning to mentally prepare myself, by having a great breakfast, working out, reviewing talking points on last time, etc. This is the formula that works for me. 

So it was go time. Once I started talking, it just all fell into place.  I presented for about 45 minutes covering everything from how to install Tableau Public to creating a dashboard, story points, as well as some data visualization best practices. 

When it was done, I felt like a kickass rockstar. I shared the knowledge I had learned and I stepped out of my comfort zone. I set a goal to be a resource in the Tableau community for newbies and the KidsCount Webinar aligned directly with that goal. I might have jumped for joy and did a little shimmy and shake.

Are the attendees going to create Jonathan Drummey-esque table calcs or create a freakin' treasure map like Matt Francis as a result of the webinar. Nope. Should they be able to gain a better understanding and start creating visualizations? Yep. And I'm good with that.

If you're interested, here are my talking points and my workbook that I created in the Webinar. 


Picture
2 Comments
    Follow my blog with Bloglovin

    RSS Feed

    What's This About?

    After using Tableau in my last position, I'm now a data viz hobbyist and this is my little slice of world dedicated to data visualization...typically Tableau related. 

    Vizzed and Confused? 
    Here are some great resources!

    Anya A'Hearn 
    Andy Cotgreave 
    Kelly Martin
    Andy Kriebel
    Matt Francis
    Jonathan Drummey
    Jewel Loree
    Peter Gilks
    Paul Banoub
    Dan Murray
    Ramon Martinez
    Ben Jones
    Allan Walker

    Tweets about "#dataviz"
    Tweets about "@tableau"

    Archives

    May 2018
    December 2017
    November 2017
    October 2017
    June 2017
    May 2017
    January 2017
    November 2016
    October 2016
    August 2016
    July 2016
    June 2016
    April 2016
    March 2016
    February 2016
    January 2016
    December 2015
    October 2015
    September 2015
    August 2015
    July 2015
    June 2015
    May 2015
    April 2015
    March 2015
    February 2015
    January 2015
    December 2014
    November 2014
    October 2014
    September 2014
    August 2014
    July 2014
    June 2014
    May 2014
    April 2014
    March 2014
    February 2014
    January 2014
    December 2013
    October 2013
    September 2013

Powered by Create your own unique website with customizable templates.