Wannabe Awesome Me
  • Viz 'Em
    • Tiny Tableau Tips
  • Mentor Match
    • Mentor Match Blog
  • A Pop of Color

Sleepless in Seattle aka #Data14

9/22/2014

3 Comments


I was at a blogging conference the weekend before #data14 and the organizer said we'd have an information hangover. I didn't feel the hangover the next day from the blogging conference but boy, did it hit me the next few days after data14. I must have booted and rallied between conferences...or something like that (since that kinda makes me sound well versed in the ways of drinking). Anyway...I found my head swimming with ideas and just the sheer magnitude of a conference this size. I want to give a massive shout out to the folks who organized the conference! There are always going to be hiccups but the positives totally outweighed the negatives. I'll touch briefly on the challenges I had during the conference, which were primarily logistical. I was surprised by how much I was impacted by having an unstructured lunch break. I didn't want to miss any of the sessions and I always seemed to miss the items in grab & go. I had the expectation to fill every slot. However, then reality set in I was super bummed that I couldn't attend Joe Mako's session on Flowing with Tableau. So that was a day I actually ate lunch and tried to put pen to paper with the ideas that were swimming through my head. I was bummed when I couldn't get in to sessions that filled up even before keynotes were finished. At least there are session recordings so I won't miss the content.

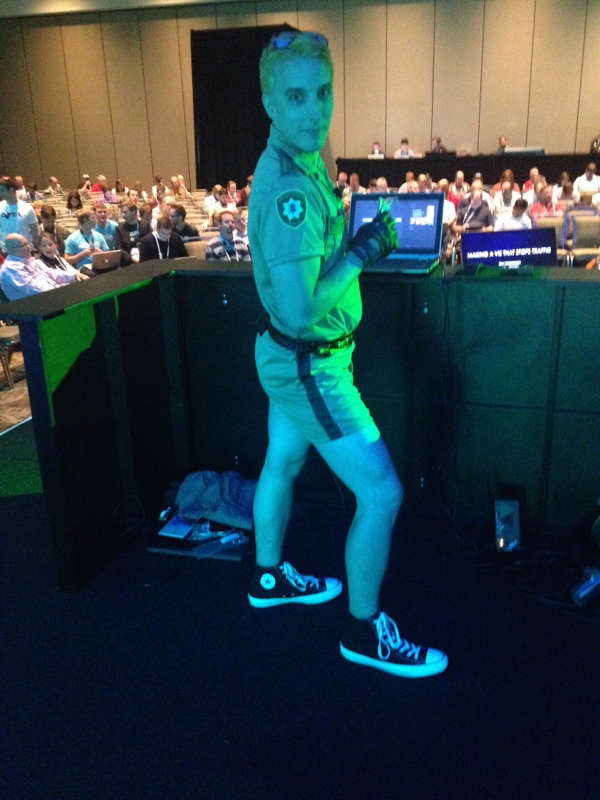
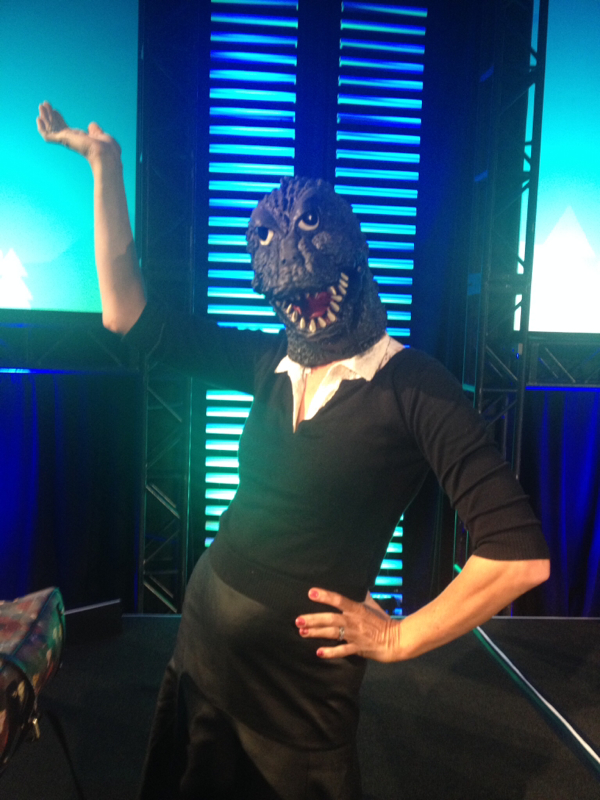
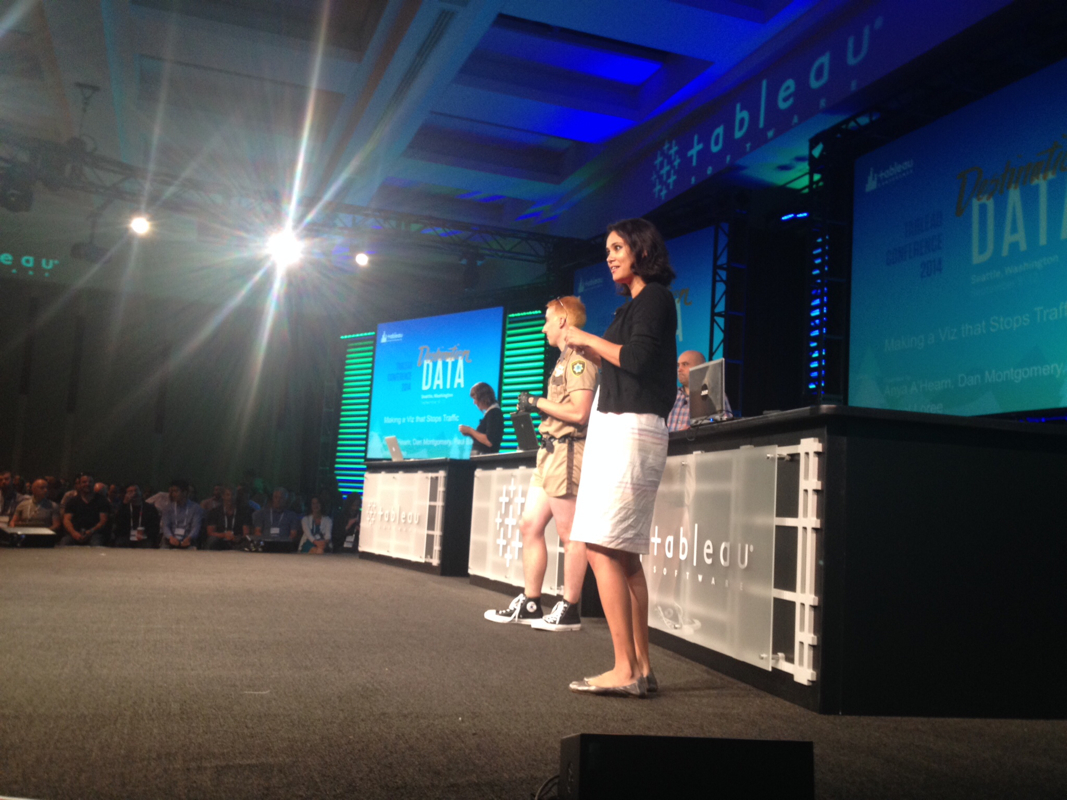
Every session I attended was very good! It was so hard to choose which sessions to go to. I think my hardest decision was between Facebook Jeorpardy: Hack Edition and Making a Viz that Stops Traffic. In the end, I chose to stop traffic. It was such a great session and reinforced some of the principals I employ and gave me new ones too. Plus, anytime you have Lt. Jim Dangle and Godzilla, you know it's going to be good.

Picture
Picture
Picture
Picture

I loved the Zen Master Tips & Tricks! A couple of takeaways from this session were:

  • How to filter without losing context (Mark Jackson)
  • Google interface shapes when adding custom shapes

It was also the first time I heard Craig Bloodworth speak. He presented tips on using server API. He sounded a bit like Charlie Brown's teacher to me. Maybe it was his accent. Joking! Actually, what he was presenting was interesting and it's amazing that there are folks that just figure this stuff out. For now, I have the reference in the event I need it.

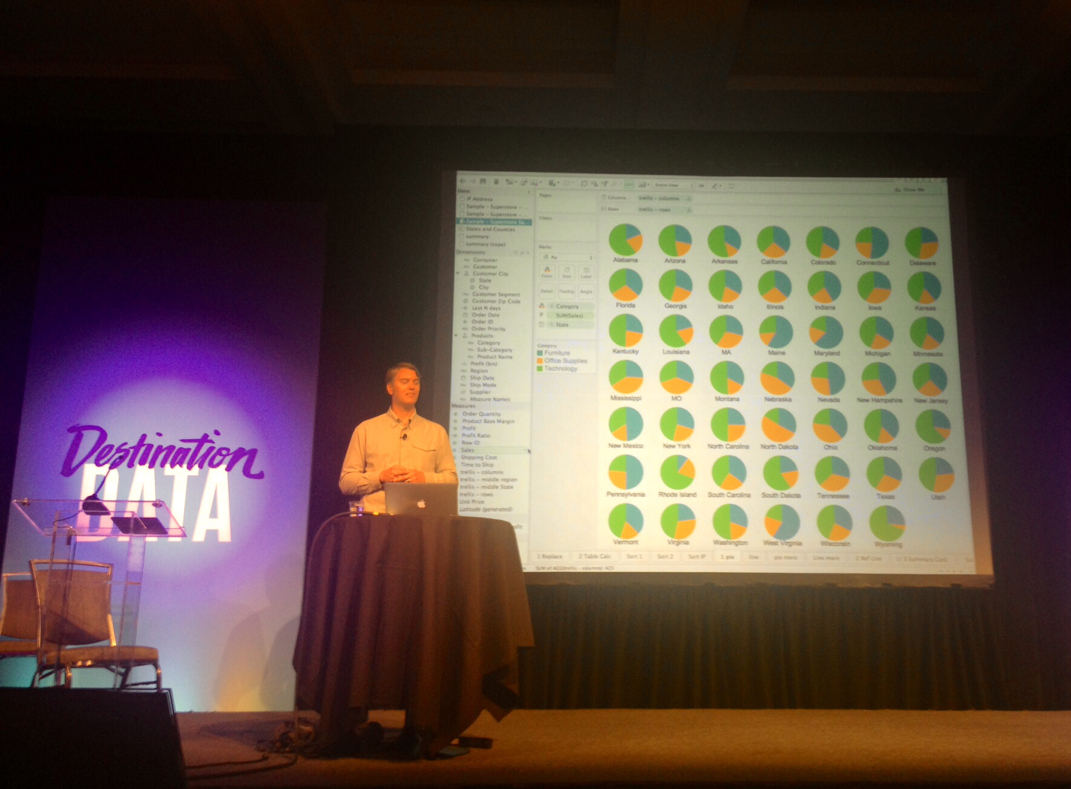
Another session I loved was presented by Marc Reuter called 10 Tips to Becoming a Jedi or 5 things that Mark really likes. A two major takeaways for me from this presentation:

  • The summary card is underutilized. Personally, I'd like to see how we can incorporate it where it makes sense as I think it gives people a better sense of the data.
  • The trellis chart. This looks difficult, but I can see how we could incorporate it into our work products. Plus, I think it's neat, so I want to try it at home.

I also went to the Tableau Like a Sith session. It was a major production. Over my head, but there were a few things that I thought I might try at home/work.

• A hack to downgrade the version.

• Mapping images to IDs and using table calcs to set the images.

• Though this isn't really sith-like, the helper calc of '1'.

I'll probably watch this recording again just so I get a better sense of what's going on and to see dancing bobba fetts.

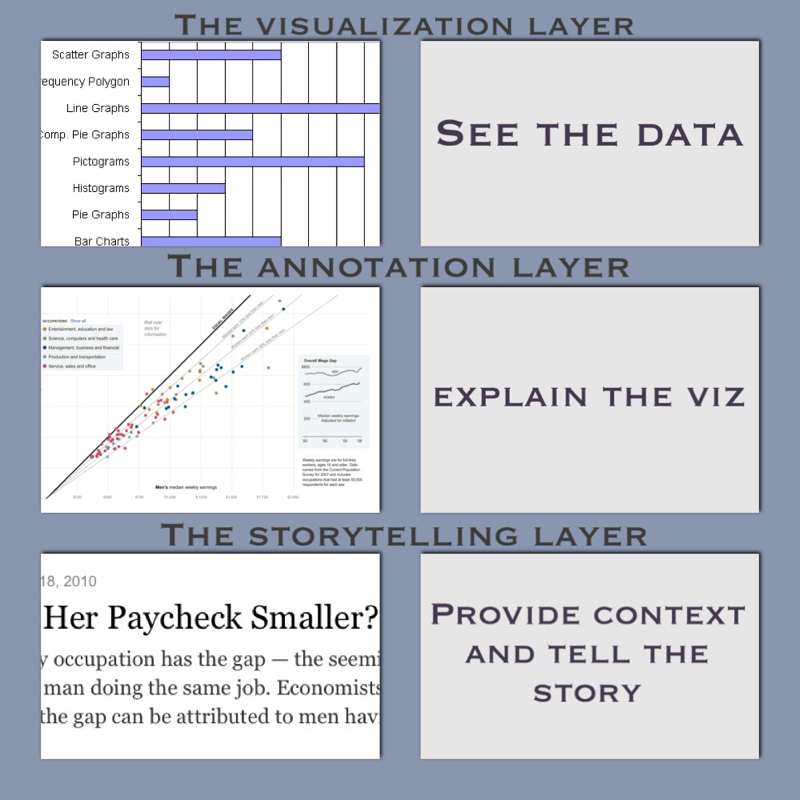
I found Robert Kosara's talk interesting as well. There are a few points that I recall from his talk.

  • Stories are a way to engage the reader further.
  • There are three layers when it comes to data storytelling.
Picture

In an effort to make progress on my goals, I attended a session by Bethany Lyons on table calcs. It was Jedi level and it hurt my head (though to be fair, that was her objective). A couple of key takeaways from this one:

  • Graph the intermediate calculation to see what's actually happening
  • Base table calculations on the data item versus table down/across/etc
  • Restarting the sort was magical too, I just don't know how to describe it (but I'll look it up later).

Then there was the light and fun Iron Viz. I 💗 this session so much because you can see the various headlines that come out of the same data set and you really get to see the contestant's analytical or creative nature. Preparation is also key! The contestants have the opportunity to look at the data set in advance. They can sketch it out, practice building it, but when it's game time, it's just them, the data, & their sous vizzers. It really exemplifies the many ways that Tableau can be used.

In addition to the great sessions, the keynotes were awesome. Dr. Tyson was funny but Tableau definitely saved the best for last, in my opinion. Dr. Rosling was fantastic! If you didn't think or say,"Yes!! Using data to make a meaningful global impact! Using data for good, that's what it's about!" or something similar, I'm not sure we can be friends anymore. Kidding. It takes all kinds of people to make the world go round. Least that's what I'll tell myself as I ponder our friendship. I love fun vizzes, but I get super excited when I see folks using visualizations to make the world a better place. I didn't want Dr. Rosling's talk to end. And I love his sense of humor!

Another fantastic aspect of the conference was the networking. That's where you get to put bodies to headshots. I finally met the Pauls, Jonathan Drummey, Chuck Hooper, & others in person. And I have to mention the #womenindata meet-up. It was great to hear from women & Jonathan about opportunities and experiences about women in data. I really hope we can continue the conversations post-conference! It was also a great networking opportunity, which was one of my goals for the conference.

While I could go on forever about the conference, even I'd get bored with hearing about it! So I suppose I'll write down my goals for the upcoming year.

  1. Be a newbie advocate. This was borne out of the newbie session that Matt & I presented at conference. So anything I can do to help folks out as they use the tool is a win win. It helps them and I also solidify my understanding of whatever the topic may be. I've already got some things in the works, so stay tuned! I am so super excited about it that everytime I think about it, I want to work on it.
  2. Similar to being a newbie advocate, I also want to help people become data viz leaders.
  3. Continue to build my social media presence in other channels, such as video.
  4. Make progress on understanding data blending and table calculations.
  5. Publish four visualizations per year on Tableau Public, with one-two being focused on health or social issues.

I've got my work cut out for me and I wouldn't have it any other way! I love the energy of the tableau and data viz community and I hope to make meaningful contributions. You'd make me the happiest girl in the world if you engage with me over twitter, hangouts, my blog, or on the Tableau Wannabe Podcast!

Oh and while I'm getting to work on these goals, check out my little scrapbook I created with photos from Destination Data!

3 Comments

Vizful Thinking

9/2/2014

0 Comments


I can't believe how time has flown! It's almost time for the this year's Tableau conference. I looked back on my posts throughout the course of the year and think hot damn, I'm good at goals! Kind of. Here's my resolution after attending TCC13:

I resolved to up my Tableau visibility and publish at least one viz on Tableau Public (and we'll see where it goes from there).  Big props in advance to Matt Francis for helping me expand my network! I'm also resolved to better understand and apply design concepts to make data beautiful and something that folks want to see. 
So, unlike New Year's resolutions, I think I actually kept these! I've published several vizzes on tableau public! I'm really proud of my work on the MS viz (part of the screen shot below). My first go at it was less than stellar, but relying on a good group of folks to provide me feedback, I was able to remember and apply the design concepts they pointed out to me. A super huge thanks to Kelly Martin, Ramon Martinez, Anya A'Hearn, and Matt Francis for the help!!! I'm also beyond thrilled that people have asked me to review their vizzes!! I get that I'm not the smartest person in the room, but I try to provide feedback that is meaningful and not totally annoying. For me, it's a big deal for folks to ask me to review their vizzes, so I'm really happy that I can make a contribution! 

Picture
Click the pic to visit my Tableau Public profile!
One of my objectives for the last conference was to build my network. Between the people I met in person at the conference and the new people I've met on twitter, I've definitely expanded my network. I am really excited about actually seeing some of the tweeters in person, instead of their avatars. Which reminds me, let me get on my soapbox for a minute.

Picture
I think networking is seen as a fluffy, somewhat superfluous activity (yeah, that's right...I busted out my favorite SAT word). But I see a big benefit in networking. For example, I wanted to show a Gantt chart with peak periods, but was super swamped at work and no time play around with it (you know those time where you're asking people to wait five minutes so you can get a drink of water and not die of dehydration? That kind of busy). Enter Matt Francis, who was able to whip up the peak period Gantt, which I've used at work. Then, on my personal vizzes, Matt, Anya, Kelly, and Ramon helped me with my major viz on MS.  This cause is extremely important to me and I wanted it to be Viz of the Day quality. I feel like I'm a pretty realistic person.  I know my skills are not superior, so I wanted help to make sure that in spite of my skills, the viz looked superior.  I went to people I knew, trusted, and felt comfortable getting constructive criticism from.  The result was a visualization that I think communicated the message of how MS changed in five years. To me, I see a network as a way to improve my skills. Side story: My mom and I were having a conversation about my career and she told me that I was always trying to be better or do something better.  I think she's right. I know I'm always trying to find a better mascara! Actually, I'm not content with status quo and I like to be busy. So, I think the combination results in always trying to improve. Ok, off of the soapbox now.  It just really annoys me when people don't see the value in networking.  

In one of my blogposts last year, I wrote about trying to find my tableau identity. I'm not a data person and I like the design aspect, even I will admit that I'm still learning that. I don't think anyone can be super skilled overnight or, I would submit, even a year. One of things that annoys me (even about myself) is when people complain about their lack of skills or their problems and not try to resolve them. I *might* just be into problem solving. So, to help with my lack of data skills, I took Google's data course which provided good foundational information. I also joined the Interaction Design Foundation to better understand the theory and do design the right way.

Picture
I made sense of some data! Gotta love free online courses.
Picture
I'm a member!

The thing I like about being a member is that I have access to courses for a year and can go at my own pace. And with two kids, work, and commuting, I definitely need that! Between doing and getting feedback on my vizzes as well as some of the theory I've learned, I'm definitely making progress.

In that post, I polled people to see how I should resolve my identity crisis. Here are the results (as of August 27, 2014).

Picture
And while I took a data course and became a member of IDF, I really am just letting it occur organically. Then in July, Stephanie Evergreen wrote a blogpost about Women in Data Viz. It's a really good read and I would recommend that you all read it now. Like now. I'll wait.


From Stephanie's blog...evidence that I'm on the list! 
Picture
 

Okay. So you've read it and there I am! Under the women who tweet about data viz. It was a bittersweet moment for me. Yay! I'm on the list! But booo! I'm on the list as a tweeter. I really questioned my value in the tableau (or even the data viz) community by 'just' tweeting. But then I reflected on it (& perhaps it's rationalizing to make me feel better) and felt like by tweeting & blogging, I'm bringing awareness to data viz and through that, perhaps I can help build data viz leaders...and perhaps that's my real value. I'm certainly a leadership dork and I want everyone to be a data viz leader. So if I can help people improve their data viz skills as well as mine through twitter, then I'm okay with that. And while I'm okay with that, I'm not sure that a lot of folks truly recognize that value, which can be frustrating. But at the end of the day, I think I found my tableau identity and I'm cool with it.

So with that notion of building skills and helping peeps out, I hosted a pre-conference hangout session with some TCC vets on August 29th. First, I would be remiss if I didn't thank Andy Kriebel for the idea and the other panelists, Anya A'Hearn, Chuck Hooper, and Ben Jones for bringing such great perspectives and tips to the discussion. I had a bunch of fun & would love to do it again! Plus, I think everyone like the Darth Vader that was looking over my shoulder. 
But all work and no play makes Em a dull girl.  So in that vein, I've been having a bunch of fun lately because my best bud, Matt Francis, and I started a Tableau podcast! We talk all things Tableau and it's been so much fun, I love it!!! Matt & I chat about the viz of the day, twitter topics, topic du jour, & I try to insert a Matt joke (some days it's easier then others). BTW, if you have a joke about Matt, send it my way and I'll give you a shout out! Our discussion on the podcast is so valuable (& entertaining) to me and I hope to others as well. And it made me think that Matt and I should actually do a hangout on air podcast. Doesn't everyone want to see us drink coffee and chat about Tableau?  Obviously, the answer is yes. 

So in addition to the podcasts and the hangout, Matt & I also have a pre-conference session on Monday September 8th from 3-4pm to help folks navigate through the biggest conference Tableau has hosted. We're repeating the session on Tuesday after Christian's keynote too!  I am so excited for these sessions we're doing, I'm going to have to drink decaf on those days. I just thought of a funny story about me from college that involved cherry pepsi, and chocolate covered espresso beans...good times! Anyway...there are an insane number of sessions to choose from and I think I've already reworked my schedule twice! 

I'm also excited about a #womenindata meet-up (September 9th 12:45-1:45 in the University Room at the Sheraton). I'm really pleased that someone in Tableau had the idea to do a women in data meet-up. I think it's challenging to be a woman in STEM. I could get on another soapbox about it. However, one soapbox in a blogpost might be enough. I think back to my first (& so far, only) hackathon at Bread for the World. Bread is a great cause and we focused on a great topic; women's empowerment. That really supported a saying I heard several years ago. It was from an entrepreneur who believed in giving people a hand up, not a hand out. When we support women's empowerment, the community as a whole benefits. A bit of a tangent, but I thought of it because one of the reasons I wanted to be involved with the hackathon was to improve my data skills. Did that happen? Nope. There was definitely a bit of a divide based on our team's approach and given the time constraints. And because I can't sit around, I started talking and tackling the visual aspect. You can check out more about the Bread for the World Hackathon in this Washington Post blogpost (which I'm pictured and quoted in...which is totally awesome)! At any rate, I want to improve my data skills and I believe that anyone can do anything with a mix of practice, talent, and a great support system. 

So back to #womenindata. Why does it matter if I'm a woman in data, or a woman in finance, or the only woman on my division's management team? Because by supporting women in these historically male dominated industries or roles, I show my daughter that she can be anything she wants to be, that her opinions and perspective matter just as much as anyone else's, that by lifting her up, we improve her community. And just because we love makeup doesn't mean we have to be pigeon-holed into the design side of things, but even if that's where our strength is, that's fine too.  This isn't some pendulum where we have to swing all the way to one side and all be coders. Any person's strength is knowing what they're good at, what they're weak in, and figuring out how they want to use that information (strengthen the good or strengthen the weak). 

So, I think I got on that second soapbox. At any rate, as I look back over the course of the year, I'm really proud of my progress, for the community in which I belong, and I'm looking forward to seeing what next year holds. Hope to see you at #data14!


0 Comments
    Follow my blog with Bloglovin

    RSS Feed

    What's This About?

    After using Tableau in my last position, I'm now a data viz hobbyist and this is my little slice of world dedicated to data visualization...typically Tableau related. 

    Vizzed and Confused? 
    Here are some great resources!

    Anya A'Hearn 
    Andy Cotgreave 
    Kelly Martin
    Andy Kriebel
    Matt Francis
    Jonathan Drummey
    Jewel Loree
    Peter Gilks
    Paul Banoub
    Dan Murray
    Ramon Martinez
    Ben Jones
    Allan Walker

    Tweets about "#dataviz"
    Tweets about "@tableau"

    Archives

    May 2018
    December 2017
    November 2017
    October 2017
    June 2017
    May 2017
    January 2017
    November 2016
    October 2016
    August 2016
    July 2016
    June 2016
    April 2016
    March 2016
    February 2016
    January 2016
    December 2015
    October 2015
    September 2015
    August 2015
    July 2015
    June 2015
    May 2015
    April 2015
    March 2015
    February 2015
    January 2015
    December 2014
    November 2014
    October 2014
    September 2014
    August 2014
    July 2014
    June 2014
    May 2014
    April 2014
    March 2014
    February 2014
    January 2014
    December 2013
    October 2013
    September 2013

Powered by Create your own unique website with customizable templates.