For this week's study notes, I'm going to document my work in parameters. When I was developing the mentoring match tool, I had the exact design laid out. Then I needed to make this sketch a reality. My first thought was using a filter to identify the mentor or mentee and to identify the skill area (in the viz, it's called the focus area). The oh so wise Matt Francis suggested parameters through a not so subtle hint of messaging me one of his post on parameters.
My Challenge
I know what I want to do, but I just don't know how to do it. I think my favorite calculation says a lot about me. It is... blank ' '. Whenever I need to use calculations, my brain turns to mush. Ugh. I get that parameters can be useful and I know that I need a calculation to make them work. But where do I begin?
I know what I want to do, but I just don't know how to do it. I think my favorite calculation says a lot about me. It is... blank ' '. Whenever I need to use calculations, my brain turns to mush. Ugh. I get that parameters can be useful and I know that I need a calculation to make them work. But where do I begin?
How I Overcame the Challenge
But first...I was thinking that I could use a filter. But that didn't work. Why? #becausedata. I have two columns that represent two questions...
1. Do you want to be a mentor?
2.Do you want to be mentored?
I also have two questions relating the focus/skill areas for each of the mentor and mentee sections.
I have to tell you, it took a couple of explanations for it to sink in as to why I couldn't use a filter and why a parameter made sense. I rang up Matt Francis and had him explain it to me so I could ask questions. This was super helpful. This was a key concept I realized...
So, now that we'e moved past the part where filters aren't a viable option, I created a parameter.
But first...I was thinking that I could use a filter. But that didn't work. Why? #becausedata. I have two columns that represent two questions...
1. Do you want to be a mentor?
2.Do you want to be mentored?
I also have two questions relating the focus/skill areas for each of the mentor and mentee sections.
I have to tell you, it took a couple of explanations for it to sink in as to why I couldn't use a filter and why a parameter made sense. I rang up Matt Francis and had him explain it to me so I could ask questions. This was super helpful. This was a key concept I realized...
- I needed to set up my collection with two questions for mentor/mentee ID and focus area (because someone could be both a mentor and a mentee). Because I had two questions for each, I couldn't do a filter (that would have only worked if I had one question (Are you a mentor or a mentee?)
So, now that we'e moved past the part where filters aren't a viable option, I created a parameter.
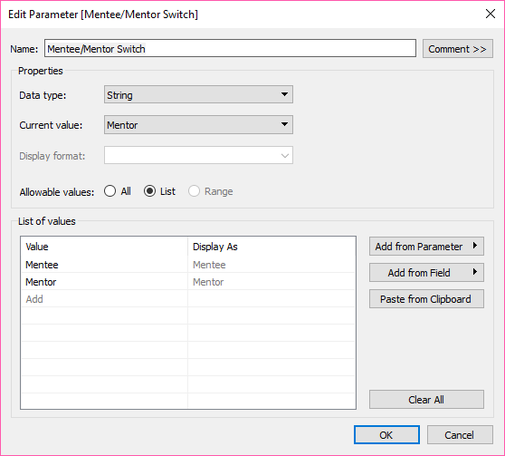
Awesome! I created this part of a parameter, look at me go! The next step was to do a calculation, oh...look at me stop. What kind of calculation do I need anyway? My brain is saying, if someone selected mentor, then mentor (and likewise for mentee). Is that right? Nope. Instead, we just created a calculated field that was just the parameter. Why the heck do I even need that? It seems like such as waste. If I create a parameter and show that control, isn't that doing the same thing?
Oh bless your heart, as my grandmother would say (and my peeps in the south can appreciate what that means). No dear, that's not the same. And here's another tweetable moment.
So, I asked Matt, why have the calculated field be the parameter (as opposed to the data items)? Because this is an easier way to get our selection. Theoretically, I could have done a calculated field with the data items, but that would have been a lot messier. No thank you! I'll take the easy road in this case.
So we've got the parameter all set up for the mentor/mentee. One other note: I pivoted my mentor/mentee data into one. Now, I know I said if it had been one column, I could have filtered. But here's the challenge I ran into...I couldn't pivot the focus area columns. Tableau wanted to add the data to the pivot I already created and that's not gonna work for me.
Oh bless your heart, as my grandmother would say (and my peeps in the south can appreciate what that means). No dear, that's not the same. And here's another tweetable moment.
- Parameters are just the interface. We can create lists or numbers but they don't work without an engine, which is the calculation.
So, I asked Matt, why have the calculated field be the parameter (as opposed to the data items)? Because this is an easier way to get our selection. Theoretically, I could have done a calculated field with the data items, but that would have been a lot messier. No thank you! I'll take the easy road in this case.
So we've got the parameter all set up for the mentor/mentee. One other note: I pivoted my mentor/mentee data into one. Now, I know I said if it had been one column, I could have filtered. But here's the challenge I ran into...I couldn't pivot the focus area columns. Tableau wanted to add the data to the pivot I already created and that's not gonna work for me.
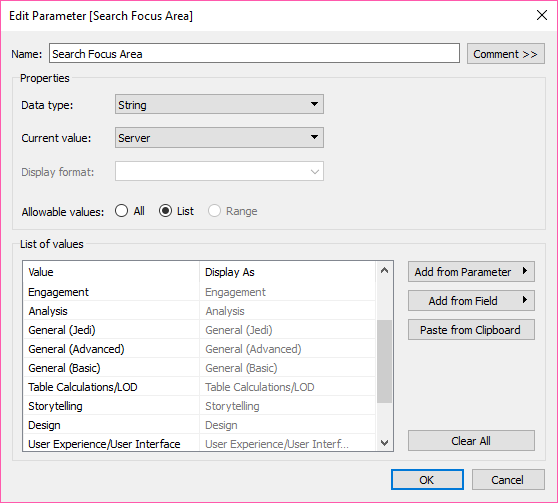
Okay, so now that we've got the mentoring parameter situation under control, we need to go it all over again for the focus area. Cool! I build a sweet little parameter.
Now it's time for the calculation. Uhhh....errr...I do the same thing as before? (Hopefully you read that with some inflection upwards at the end). No, this time, we need two calculations! What the what? Why can't it be the one like in the mentor/mentee paramter?
Bless my heart...
So here's why we need two calculations (or we could have done one nested calculation, but let's not get too crazy here).
1. We need to know if we're searching through the mentor or the mentee list.
2. We need to know what focus area we need to search for.
That translates to this calculation:
The first is called Search Focus Area.
IF [Mentee/Mentor Switch]= "Mentor" THEN [Identify the focus area (for mentoring others)]
ELSEIF [Mentee/Mentor Switch] = "Mentee" THEN [Identify the focus area (to receive mentoring)]
END
We also needed a calculation to control the parameter, which in this case uses a contains statement.
CONTAINS([Search Focus Area Switch Result],[Search Focus Area])
Why contains? You're never gonna believe it.
#becausedata
Google Forms brought over all of those data items I had as checkboxes as data separated by commas. So the contains lets us search for server in a string that might contain server, design, and color.
So the calculation in narrative form would be something like this...
When someone selects server, look through mentoring rows for server if they are looking for a mentor (and vice versa for a mentee).
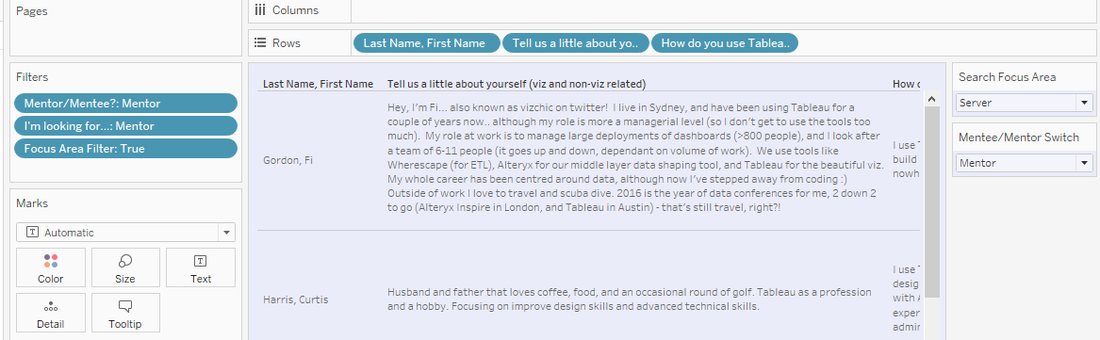
We threw up the calculated fields on the filter shelf, showed the parameter controls, and what do you know, two working parameter controls.
Bless my heart...
So here's why we need two calculations (or we could have done one nested calculation, but let's not get too crazy here).
1. We need to know if we're searching through the mentor or the mentee list.
2. We need to know what focus area we need to search for.
That translates to this calculation:
The first is called Search Focus Area.
IF [Mentee/Mentor Switch]= "Mentor" THEN [Identify the focus area (for mentoring others)]
ELSEIF [Mentee/Mentor Switch] = "Mentee" THEN [Identify the focus area (to receive mentoring)]
END
We also needed a calculation to control the parameter, which in this case uses a contains statement.
CONTAINS([Search Focus Area Switch Result],[Search Focus Area])
Why contains? You're never gonna believe it.
#becausedata
Google Forms brought over all of those data items I had as checkboxes as data separated by commas. So the contains lets us search for server in a string that might contain server, design, and color.
So the calculation in narrative form would be something like this...
When someone selects server, look through mentoring rows for server if they are looking for a mentor (and vice versa for a mentee).
We threw up the calculated fields on the filter shelf, showed the parameter controls, and what do you know, two working parameter controls.
Tweetable Takeaways
- #becausedata Data drives what we do when it comes to filters/parameters.
- Parameters are an awesome way to select sheets in a dashboard.
- Parameters are pretty awesome to search for keywords in a string of text.
- Parameters are the interface, calculations are the engine.
- Write out what you want/think the calculation should be in narrative, try it in the calculation language, and if you don't succeed, ask for help.
And that my friends, is a discussion on parameters from a non-programmer. I feel a bit better/more confident about using parameters. So now I'll look to reinforce this work with another viz soon. Comment below and let me know if this was helpful!
 RSS Feed
