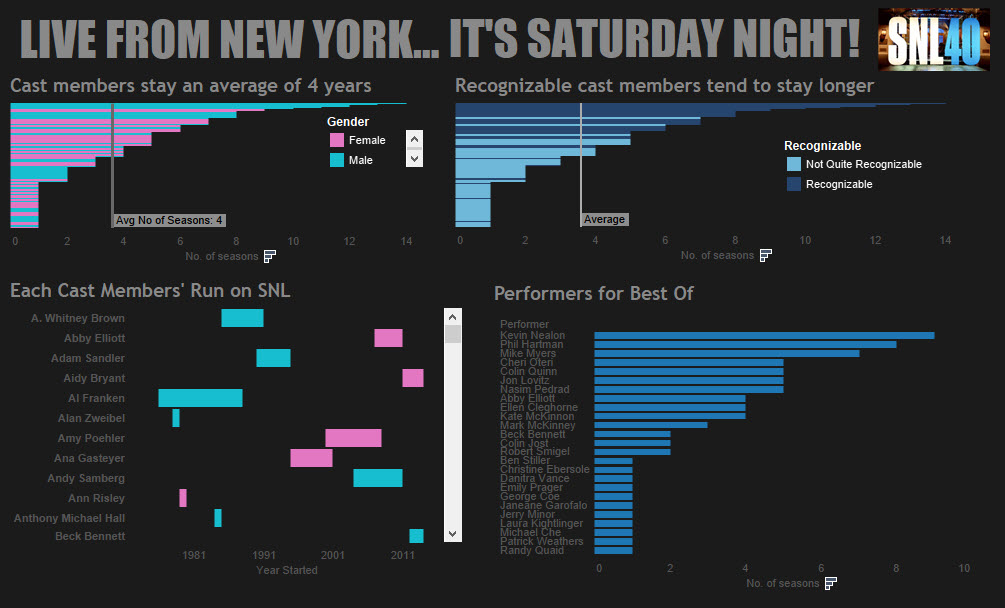
As part of my Do Something goal and inspired by SNL40, I made this little viz. It's not perfect, but it's something. I'm actually looking forward to playing with this viz even more. Big props to Matt Francis for giving me the idea and to Andy Kriebel for suggesting a Gantt chart (which is actually the first one I've done)!
2 Comments
2/23/2015 03:27:39 am
This is interesting! This kind of charting would be great for all sorts of business statistics and advertising as well. It caught my eye though because I have been watching SNL forever. I still dvr it every week! Have a great week Emily!
Reply
Emily Kund
2/23/2015 10:00:17 am
Hey Diane! Thus was made in tableau and it is super helpful in a business setting (& for creating fun stuff like this too)! Have an awesome week!
Reply
Leave a Reply. |
What's This About?After using Tableau in my last position, I'm now a data viz hobbyist and this is my little slice of world dedicated to data visualization...typically Tableau related. Vizzed and Confused?
|