|
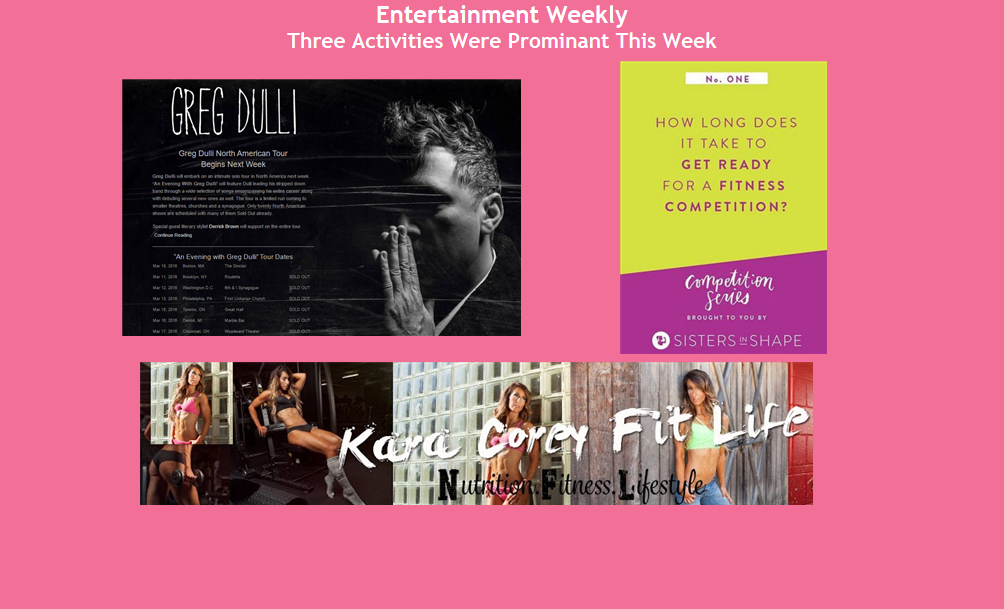
March's Data Chain theme was about entertainment. I tracked how I spent most of my free time in google sheets and then visualized it. What's not shown below are the activities that I do pretty much all the time, like fitness (strength training, running, and now posing practice) and engaging over social media. Recently, I've been on Pinterest more in an attempt to gain more insight about figure and bikini competitions given my upcoming show. I had found a YouTube clip from Kara Corey Fit Life on Pinterest and have kind of binge-watched these short little clips. And the major highlight, An Evening with Greg Dulli. Now that's the visualization is done, I'll update the blog post with the postcard once it's drawn out!
1 Comment
SQIAR
4/19/2016 08:42:42 am
Just wish to say your article is as surprising.
Reply
Leave a Reply. |
What's This About?After using Tableau in my last position, I'm now a data viz hobbyist and this is my little slice of world dedicated to data visualization...typically Tableau related. Vizzed and Confused?
|

 RSS Feed
