You know when the kids are watching Scooby-Doo, you're enjoying a cup of coffee reading your Bloglovin' feed and start looking at a viz, and then think, "I wonder what this would look like, if...". The kiddos granted me enough peace that I could actually ponder life's questions and play around with Andy Kriebel's FB Commute by Shuttle Analysis viz.
Click the image to interact with Andy's viz.
So there were three things that I noticed when I was looking at this viz.
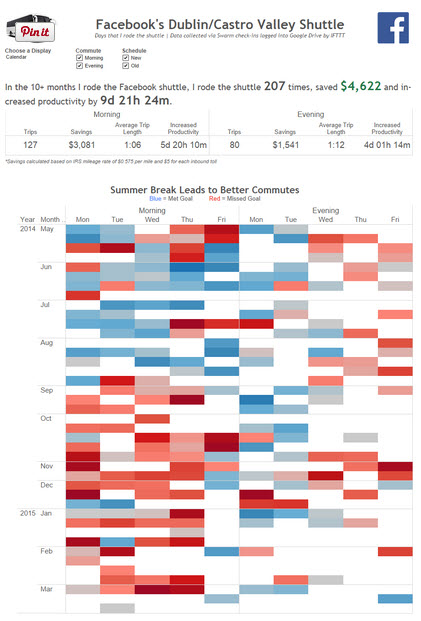
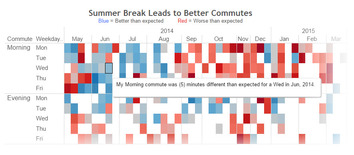
1) The header said that Summer Breaks Lead to Better Commutes but then I see weekdays on columns. So I was wondering what it would look like if weekdays and months were swapped, so that I could more easily see if the commute was better in the summer.
2) Super nit-picky, but I wanted to see what the summary above the viz looked like without the lines.
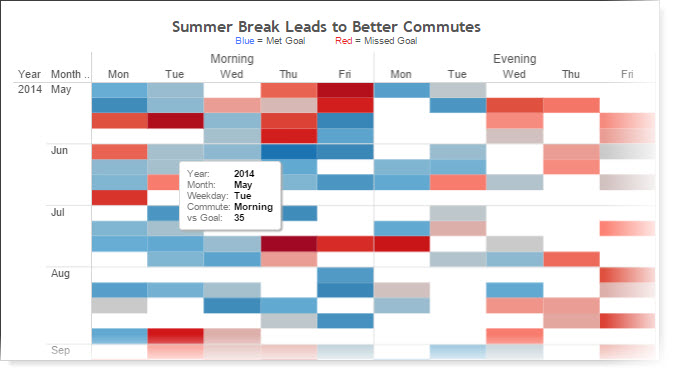
3) As I was playing around, I saw the tool tips, which are based on the defaults. Personally, I love to customize tool tips.
1) The header said that Summer Breaks Lead to Better Commutes but then I see weekdays on columns. So I was wondering what it would look like if weekdays and months were swapped, so that I could more easily see if the commute was better in the summer.
2) Super nit-picky, but I wanted to see what the summary above the viz looked like without the lines.
3) As I was playing around, I saw the tool tips, which are based on the defaults. Personally, I love to customize tool tips.

So this was kind of frightening on Saturday morning....I heard Andy's voice in my head telling me to download it and see what the viz would look like if I made some changes. So that's what I did. I swapped the columns and rows, I tweaked the tooltips to look more like a sentence, I changed 'goal' to be 'expected' (I think he's played/watched too much soccer/football), and I got rid of the gridlines. I was also playing around with the size of the viz. So, why exactly did I do all of this? I suppose because I was curious and because I could. I really wanted to see if swapping would make a difference (because then I'll think about that the next time I build a viz). Here's an image of the viz with my changes.
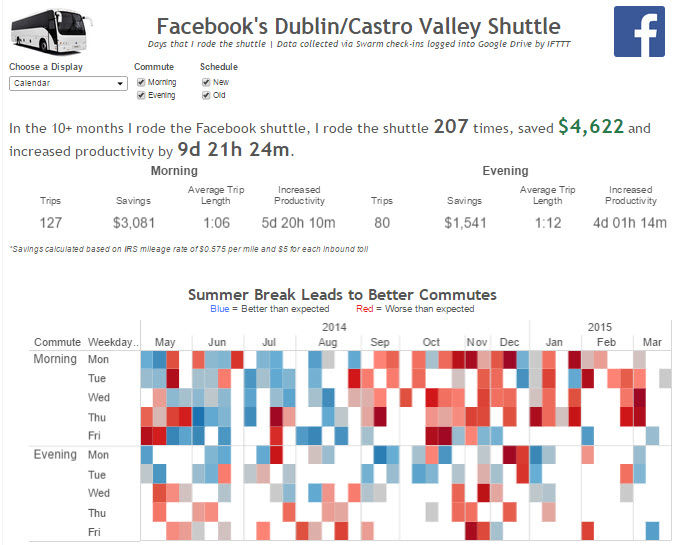
Click the image to interact with the viz.
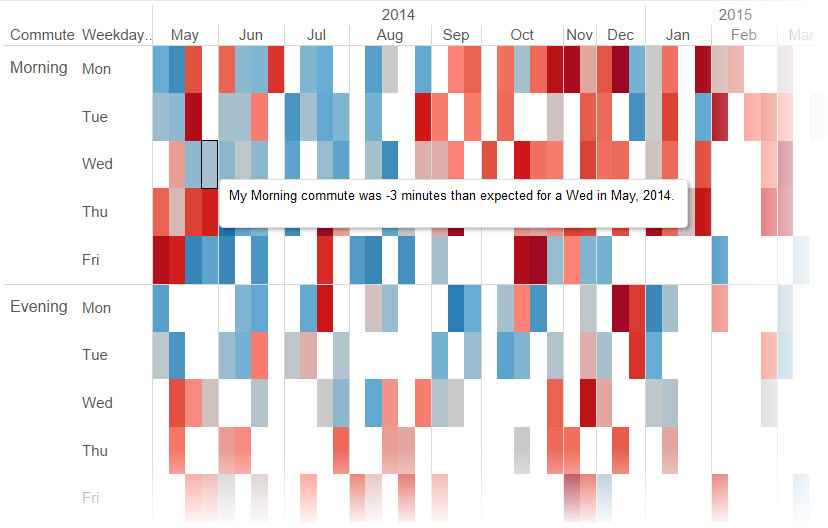
Tooltip tweaked!
So here's a visual comparison recap. Big shout out to my kids for the peace and Andy for having a nice viz I could play around with.
Visual Comparison
So, what do you think? Curious about some other changes? Download the workbook and give it a go!
  |   |
 RSS Feed
