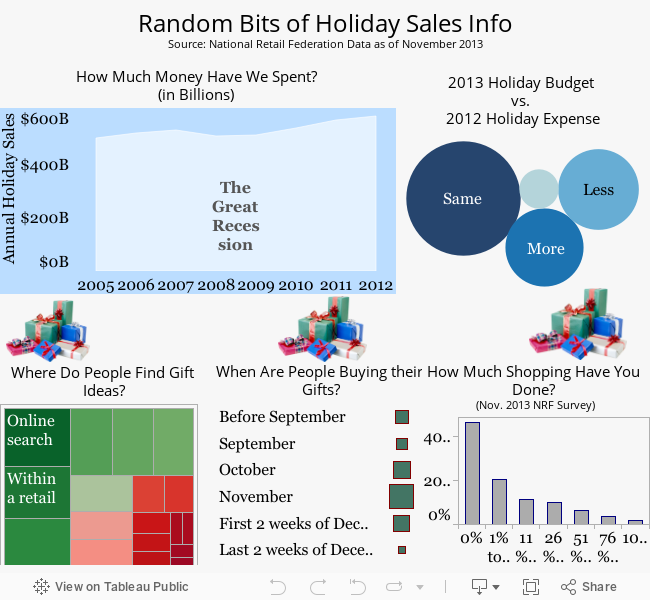
A viz in progress, I think. I wanted to play around a bit and since we just went through one of the biggest shopping weekends of the season, I thought it would be fun to have random bits of holiday sales information. Since I'm not the one vizzing at work anymore, I'm still getting used to the functionality in V8. I love graphics, but I didn't want it to be too infographicy, so I picked an image of a bunch of presents that I hope tie to the blues, light gray, reds, and greens together in the viz. Interested in what the data looks like on the National Retail Federation's website? Then click here!
|
|
What's This About?After using Tableau in my last position, I'm now a data viz hobbyist and this is my little slice of world dedicated to data visualization...typically Tableau related. Vizzed and Confused?
|
 RSS Feed
