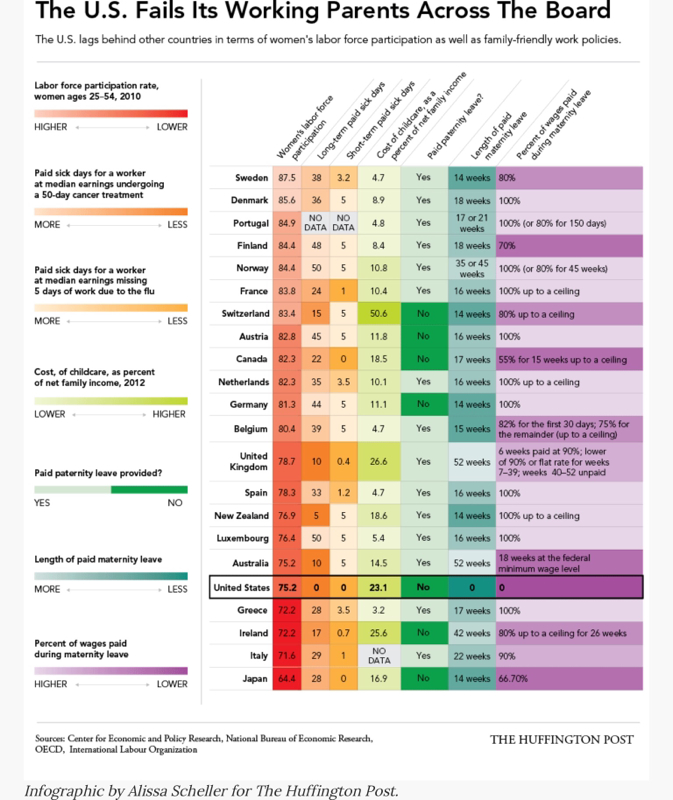
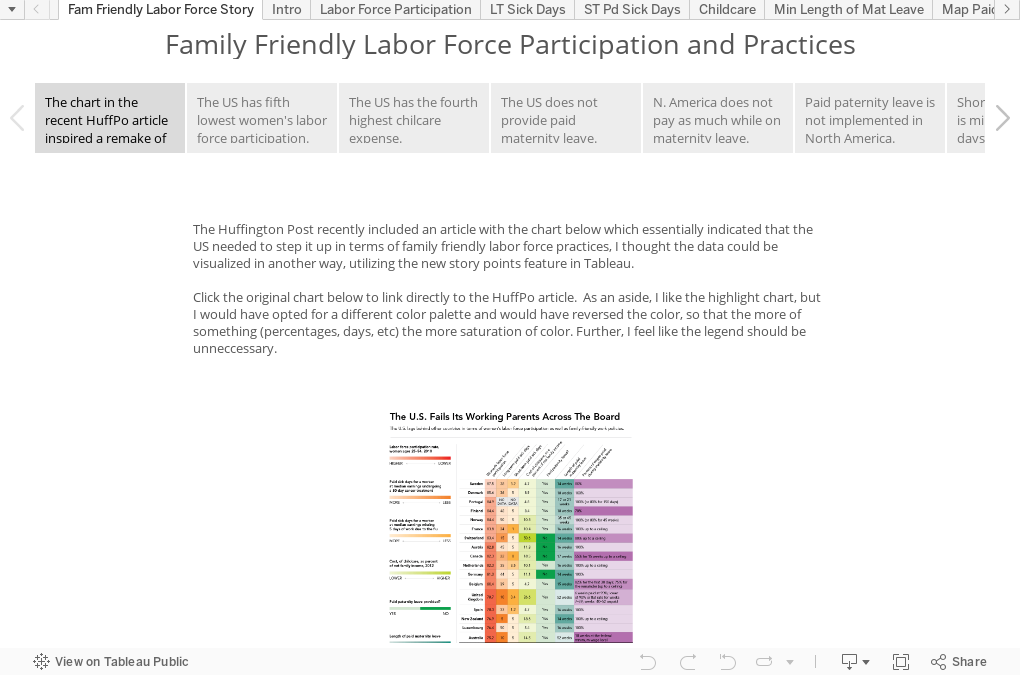
I like HuffPo and I can usually find an article on the twitter timeline that will grab me. Most recently, it was a story about how the US doesn't provide for family leave and has a lower participation rate of women in the workforce. Last time I read a similar article about how pay equality wasn't a big issue as people were making it to be, I wrote a blogpost about how pay equality wasn't just a lady issue. This time however, it was the chart that caught my attention.
I like the idea of putting some narrative with each area that I want to call out. I had story points on the brain the other day when I attended my first hackathon at
Bread for the World Institute. I was part of a group that was working on visualization concepts to raise awareness and show the linkage between women's empowerment and stunting. Since we ran out of time, I now have another little side project to work on...telling the story of child development/stunting among various countries. I think story points could be very impactful.
Getting back to the current story, I didn't read a help file, so I've probably just scratched the surface on what story points can do and how I can really make it look sharp. The way I see it, I have lots of stories to tell, which means lots of opportunities to leverage this new feature in Tableau.
Tell your own story by getting some data and downloading Tableau Public 8.2!
 RSS Feed
