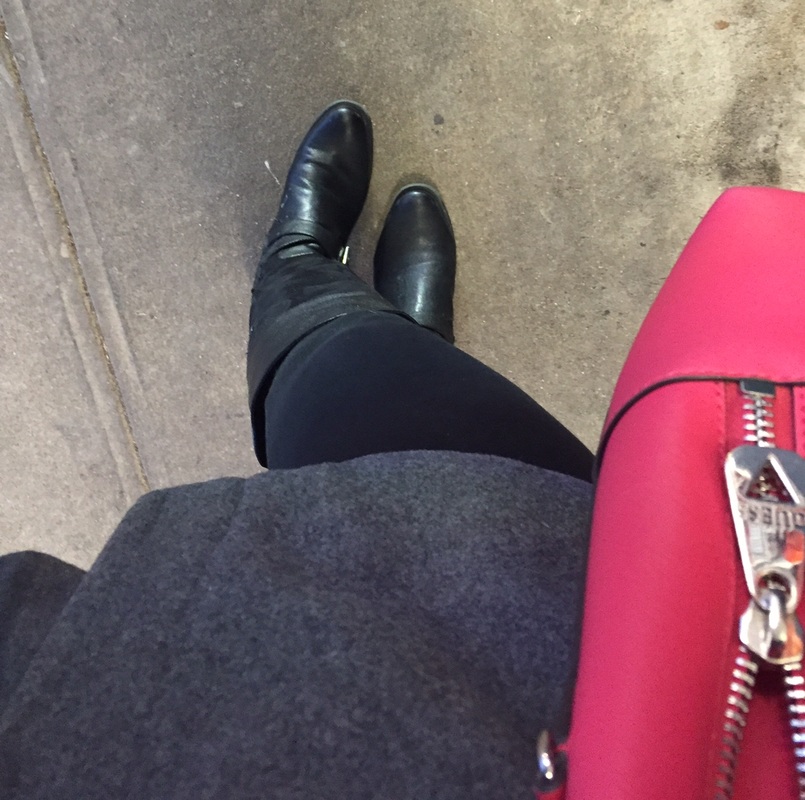
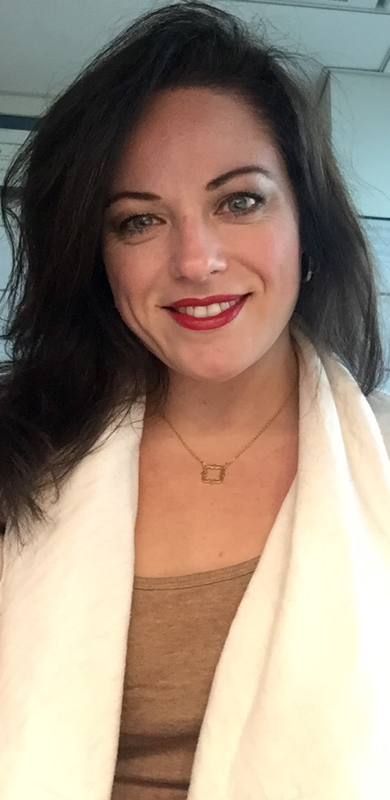
If you know me, then you know I love a pop of color. But I know my data nerds are like, show us the data behind that statement. Being that I like data viz, here are three recent pictures from my Instagram feed. Pops of pinks and red...that's basically how I think. You're basically reading a post from a girl who went back to her natural medium brown hair color (which actually looks dark), because it would contrast nicely with a hot pink cocktail dress I wore at a wedding.

So as I thought about data viz in particular, it was only natural for me to want to do something with color.
So, what am I doing here?
I really want to curate color content (I couldn't help myself with the alliteration). In all seriousness, I really want this blog to develop into a reference for color as it relates to data visualizations.
What will you find here?
- Makeovers and makeunders. Too much color? Not enough color? These revisions will focus on color (along with the what I changed and why).
- Curated content. Whether it's blogposts, infographics, or other information, I want to have it one place so that I (errr, I mean you) don't have to search too hard for it.
- Tableau how-tos.
- Anything else my colorful little heart desires (that's relevant to color and dataviz).
Thanks for stopping by and stay tuned for more pops of color!

 RSS Feed
